. 2005 Jan;16(1):84-96.
doi: 10.1091/mbc.e04-04-0277. Epub 2004 Nov 3.

R-Ras controls membrane protrusion and cell migration through the spatial regulation of Rac and Rho

Affiliations

R-Ras controls membrane protrusion and cell migration through the spatial regulation of Rac and Rho

Michele A Wozniak et al. Mol Biol Cell. 2005 Jan.

Abstract

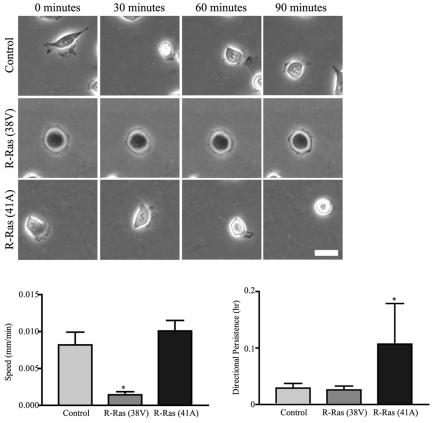
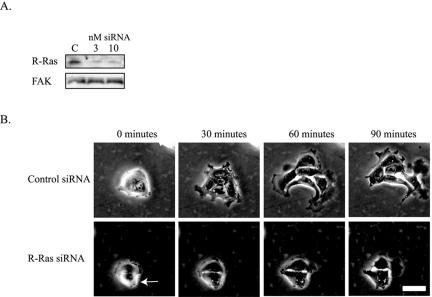
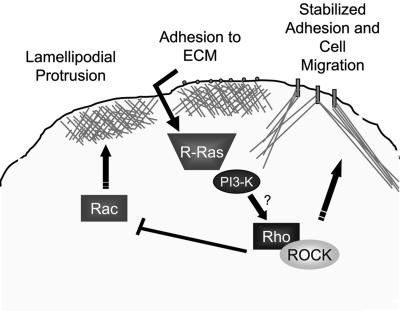
Although it is known that the spatial coordination of Rac and Rho activity is essential for cell migration, the molecular mechanisms regulating these GTPases during migration are unknown. We found that the expression of constitutively activated R-Ras (38V) blocked membrane protrusion and random migration. In contrast, expression of dominant negative R-Ras (41A) enhanced migrational persistence and membrane protrusion. Endogenous R-Ras is necessary for cell migration, as cells that were transfected with siRNA for R-Ras did not migrate. Expression of R-Ras (38V) decreased Rac activity and increased Rho activity around the entire cell periphery, whereas expression of dominant negative R-Ras (41A) showed the converse, suggesting that R-Ras can spatially activate Rho and inactivate Rac. Consistent with this role, endogenous R-Ras localized and was preferentially activated at the leading edge of migratory cells in response to adhesion. The effects of R-Ras on cell migration are mediated by PI3-Kinase, as an effector mutant that uncouples PI3-Kinase binding from R-Ras (38V) rescued migration. From these data, we hypothesize that R-Ras plays a key role in cell migration by locally regulating the switch from Rac to Rho activity after membrane protrusion and adhesion.


Figures

Figure 1.
Figure 1.
Determination of the optimum collagen concentration for T47D random cell migration. Control T47D cells and cells expressing activated R-Ras (38V) were plated on various concentrations of collagen-coated Petri plates for 1 h. Time-lapse microscopy sequences were acquired for 30 min, with one image collected per minute. The movies were then analyzed by counting the number of cells migrating in the field and relative migration expressed as the number of migrating cells/total number of cells. Altering collagen concentration had no effect on cell migration by R-Ras (38V)-expressing cells. Control cells, solid line; R-Ras (38V)-expressing cells, dashed line.
Figure 2.
Figure 2.
R-Ras regulates random cell migration across collagen. Control T47D cells, cells stably expressing activated R-Ras (38V), or cells stably expressing dominant negative R-Ras (41A) were plated on collagen-coated Petri plates (3 μg/ml) for 1 h. Time-lapse microscopy sequences were acquired for 90 min, with one image collected per minute (see Supplementary Videos 1, 2, and 3). Shown here is a representative cell at 0, 30, 60, and 90 min during the observation period. Scale bar, 25 μm. Expression of activated R-Ras significantly (*p < 0.05 vs. control) decreases cell speed, whereas expression of dominant negative R-Ras (41A) increases (p = 0.2) speed. Twenty individual cells from three experiments were tracked using a cell tracking program (Nanotrack, Inovision Software) and cell speed (mm/min) was calculated using the random walk equation (Maheshwari and Lauffenburger, 1998). Expression of dominant negative R-Ras (41A) increases directional persistence (*p < 0.05 vs. control).
Figure 3.
Figure 3.
Transfection of siRNA toward R-Ras blocks cell migration. (A) T47D cells were transfected with a pool of four nonspecific control siRNAs (labeled C) or with 3 or 10 nM siRNA directed against R-Ras. After 2 days, the cells were lysed and immunoblotted for R-Ras or for FAK as a control. The R-Ras siRNA knocks down the majority of endogenous R-Ras. (B) Two days after transfection of 3 nM control or R-Ras siRNA, T47D cells were plated on collagen (3 μg/ml) for 1 h, and then time-lapse microscopy sequences were acquired for 90 min, with one image taken per minute (see Supplementary Videos 4 and 5). Shown is a representative cell. The arrow indicates which cell was transfected with R-Ras siRNA, which was determined by using fluorescently labeled Alexa-Fluor oligos. Scale bar, 25 μm.
Figure 4.
Figure 4.
R-Ras modulates protrusive activity during cell migration. Control cells protrude and retract, whereas cells expressing activated R-Ras (38V) show little protrusive activity. Cells expressing dominant negative R-Ras (41A) protrude continuously, consistent with the observed increased persistence. T47D cells were plated on collagen (3 μg/ml) for 1 h and then time-lapse microscopy sequences were acquired for 10 min, with one image collected every 3 s. A one pixel-wide line was drawn along a protrusion in order to generate a kymograph using Metamorph software (Bear et al., 2002). Fifty protrusions from two separate experiments were analyzed, per cell type, and protrusive velocity was then calculated as previously described (Bear et al., 2002), *p < 0.05 versus control. Scale bars: x, 2.5 min; y, 15 μm.
Figure 5.
Figure 5.
R-Ras regulates cell polarity. T47D cells were plated on collagen-coated coverslips (3 μg/ml) for 45 min and then coimmunostained for p16, a component of the arp2/3 complex, and actin. The merge shows actin in green and p16 in red. Control cells localize p16 and a rich actin network to the leading edge. This is enhanced in cells expressing dominant negative R-Ras (41A) and diminished in cells expressing activated R-Ras (38V). Scale bar, 25 μm. One hundred cells from three individual experiments were counted, and p16 staining was scored as polar, nonpolar, or diffuse. The percent of polar cells ± SEM are graphed. Expression of activated R-Ras (38V) significantly (*p < 0.05) decreases the number of polar cells, whereas expression of dominant negative R-Ras (41A) significantly (**p < 0.05) increases the number of polar cells.
Figure 6.
Figure 6.
R-Ras enhances Rho activity and decreases Rac activity. T47D cells were plated on a collagen-coated plate (3 μg/ml) for 45 min. (A) Cells were lysed and 30 μg PBD:GST was incubated with the lysates to pull down active Rac. Active and total protein was detected by Western blotting. Expression of activated R-Ras (38V) decreases (p = 0.15) Rac activity, whereas expression of dominant negative Rac slightly enhances (p = 0.72) Rac activity. (B) RBD:GST was used to determine Rho activity. Expression of activated R-Ras (38V) significantly enhances Rho activity, whereas expression of dominant negative R-Ras (41A) decreases (p = 0.08) Rho activity. Quantification was performed on three individual experiments and is shown in the bar graphs on the right (±SEM; *p < 0.05 vs. Control, + collagen).
Figure 7.
Figure 7.
R-Ras alters the spatial localization of active Rac and Rho. After cell fixation and permeabilization, 100 μg/ml GBD: GST was incubated with the cells, followed by an anti-GST antibody, and then secondary antibody. Expression of activated R-Ras (38V) caused an increase in active Rho along the periphery of cells and a loss of active Rac (see arrows). Expression of dominant negative R-Ras (41A) caused an increase in the amount of activated Rac localized to lamellipodia (see arrows). Scale bar, 25 μm.
Figure 8.
Figure 8.
R-Ras is activated at the leading edge and upon adhesion to collagen. (A) T47D control cells and cells expressing activated R-Ras (38V) were plated on collagen-coated coverslips and immunostained for R-Ras, which localizes to membranes (right panel). Control motile cells also localize endogenous R-Ras to the leading edge (see arrows in left panel). Scale bar, 25 μm. (B) Cell lysates from pseudopodia and cell bodies were prepared as previously described (Cho and Klemke, 2002). Raf RBD:GST, 50 μg, was used to pulldown GTP-bound R-Ras from lysates as detailed in the Materials and Methods. ERK was also analyzed as a loading control (Brahmbhatt and Klemke, 2003). R-Ras activity is significantly increased (*p < 0.05 vs. cell body) in the protruding pseudopod. (C) T47D cells were plated on collagen or BSA-coated plates and the R-Ras activity assay performed. Cells plated on collagen showed increased (p = 0.12 vs. no collagen) R-Ras activity. All quantification was performed on three individual experiments.
Figure 9.
Figure 9.
Inhibition of ROCK in cells expressing activated R-Ras rescues Rac activity, focal complex formation and cell migration. (A) Control cells and cells expressing activated R-Ras were pretreated with Y27632 for 15 min, plated on collagen (3 μg/ml) for 45 min, and then the Rac activity assay was performed. Inhibition of ROCK in cells expressing activated R-Ras (38V) restores Rac activity. Quantification was performed on three individual experiments (*p < 0.05 vs. R-Ras (38V)). (B) Cells expressing activated R-Ras (38V) were treated with 10 μg/ml C3 exoenzyme, to inhibit Rho, or 10 μM Y27632, to inhibit ROCK, 10 min before time-lapse sequences acquired and left on for the duration of the time-lapse series. Time-lapse sequences were acquired for 90 min, with one image collected per minute. Inhibition of ROCK with Y27632 in cells expressing activated R-Ras (38V) enables the cells to migrate with significantly (*p < 0.05 vs. control) enhanced speed and persistence, whereas inhibition of Rho significantly increases cell persistence (**p < 0.05 vs. control). Scale bar, 25 μm. (C) T47D cells were treated with 10 μg/ml C3 exoenzyme, to inhibit Rho, or 10 μM Y27632, to inhibit ROCK, for 15 min and then plated on collagen coated coverslips (3 μg/ml) for 45 min. Cells were then immunostained for FAK phosphorylated at Y397, a marker of focal adhesions. Scale bar, 25 μm.
Figure 10.
Figure 10.
R-Ras regulates cell migration through the spatial localization of PI3-Kinase. (A) PI3-Kinase is needed for R-Ras to exert its effects on cell migration. Expression of an effector mutant of R-Ras that uncouples binding to PI3-Kinase rescues migration. Cells stably expressing the effector mutant of activated R-Ras (38V/61S) were plated on collagen-coated Petri plates (3 μg/ml) for 1 h. Time-lapse microscopy sequences were acquired for 45 min, with one image collected per minute (see Supplementary Video 8). Shown here is a representative cell at 0, 15, 30, and 45 min during the observation period. Scale bar, 25 μm. (B) Localization of PI3-Kinase is dependent on R-Ras activity. T47D cells were plated on collagen-coated coverslips (3 μg/ml) for 45 min and then immunostained for PI3-Kinase. PI3-Kinase is localized to the leading edge of control cells (see arrows) and expression of activated R-Ras (38V) disrupts this polar localization. Scale bar, 25 μm.
Figure 11.
Figure 11.
Model for the regulation of cell migration by R-Ras. Rac is activated at the leading edge to promote lamellipodial formation and membrane protrusion. On protrusion and subsequent integrin-mediated adhesion to the ECM, R-Ras becomes activated. GTP-bound R-Ras can then spatially activate Rho by an unknown mechanism that involves PI3-Kinase, which will inactivate Rac, leading to stabilization of the protrusion. Cycles of such events ultimately result in productive cell migration.

References

    1. Alblas, J., Ulfman, L., Hordijk, P., and Koenderman, L. (2001). Activation of Rhoa and ROCK are essential for detachment of migrating leukocytes. Mol. Biol. Cell 12, 2137-2145. - PMC - PubMed
    1. Allen, W. E., Zicha, D., Ridley, A. J., and Jones, G. E. (1998). A role for Cdc42 in macrophage chemotaxis. J. Cell Biol. 141, 1147-1157. - PMC - PubMed
    1. Arthur, W. T., Petch, L. A., and Burridge, K. (2000). Integrin engagement suppressed RhoA activity via a c-Src-dependent mechanism. Curr. Biol. 10, 719-722. - PubMed
    1. Arthur, W. T., and Burridge, K. (2001). RhoA inactivation by p190RhoGAP regulates cell spreading and migration by promoting membrane protrusion and polarity. Mol. Biol. Cell 12, 2711-2720. - PMC - PubMed
    1. Banyard, J., Anand-Apte, B., Symons, M., and Zetter, B. R. (2000). Motility and invasion are differentially modulated by Rho family GTPases. Oncogene 19, 580-591. - PubMed

Publication types

MeSH terms