. 2004 Nov 3;24(44):10013-21.
doi: 10.1523/JNEUROSCI.3298-04.2004.

Endocannabinoids link feeding state and auditory perception-related gene expression

Affiliations

Endocannabinoids link feeding state and auditory perception-related gene expression

Ken Soderstrom et al. J Neurosci. .

Abstract

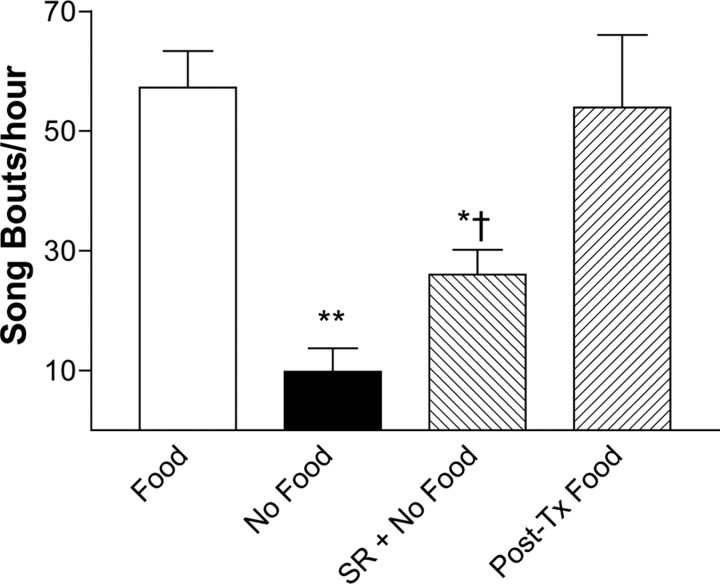
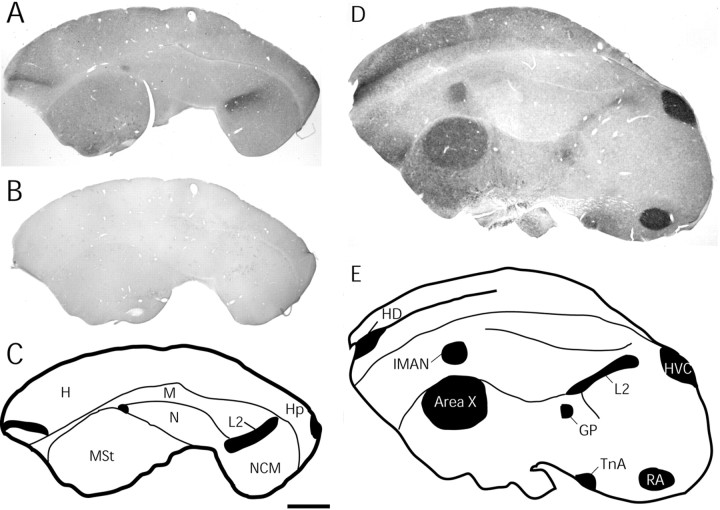
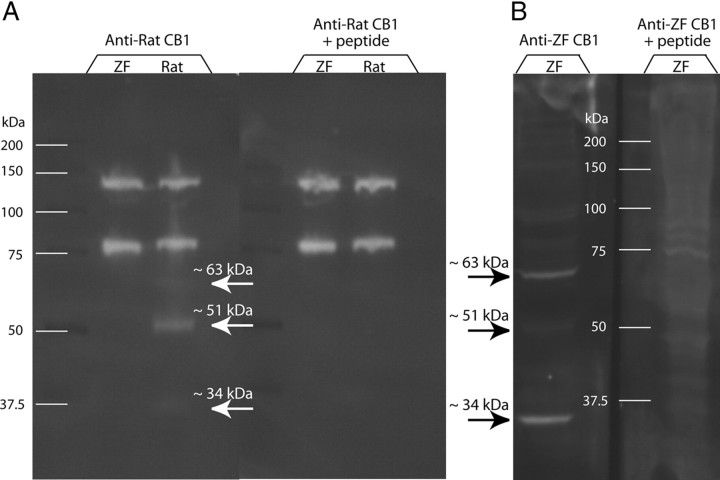
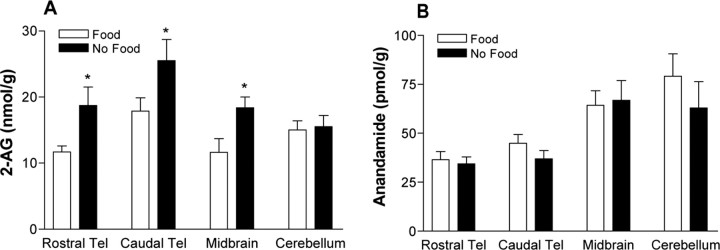
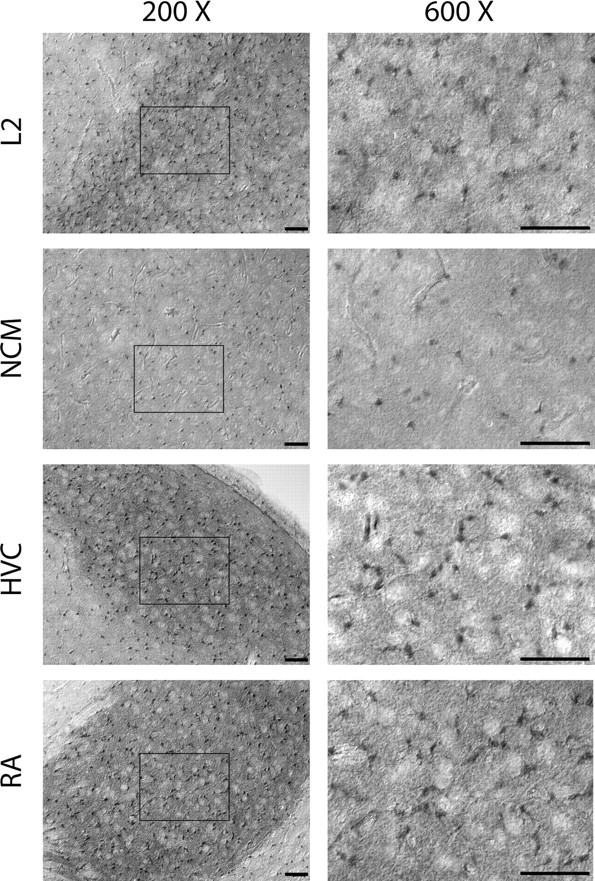
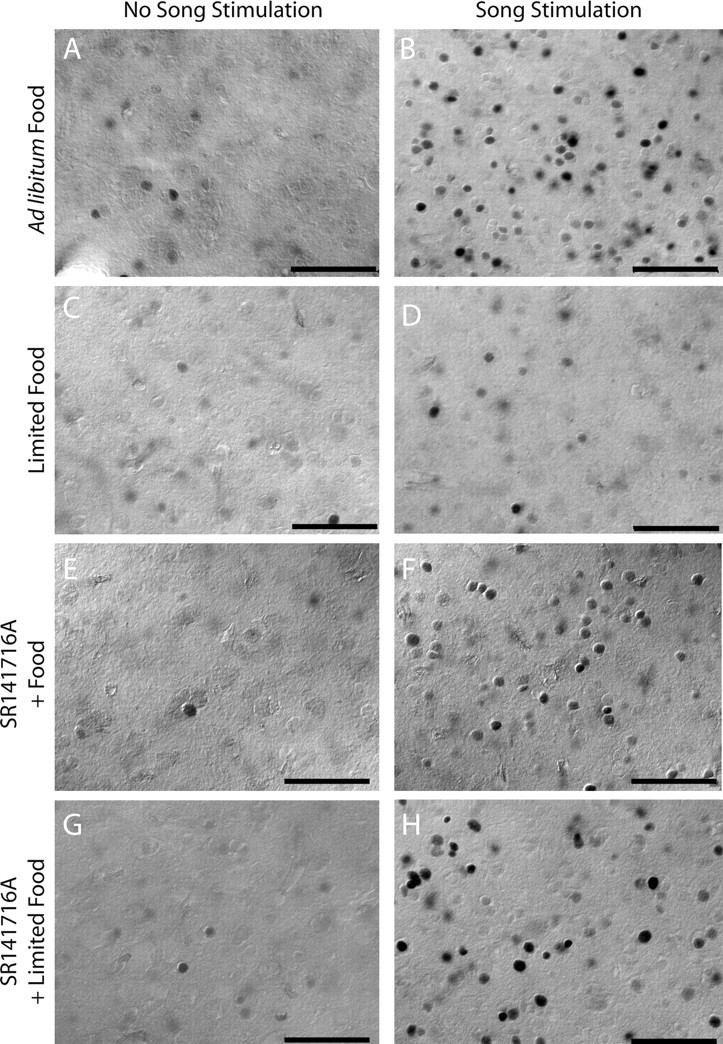
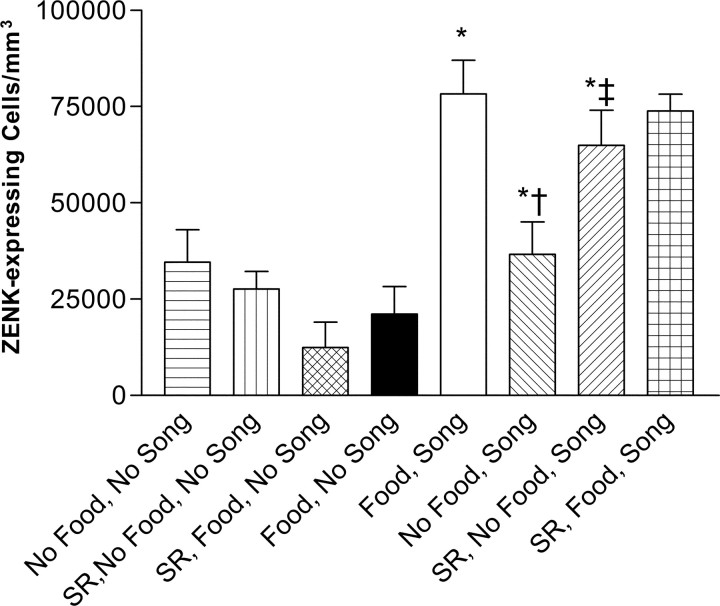
Singing by adult male zebra finches is a learned behavior important for courtship, kin recognition, and nest defense (Zann, 1996) and is inhibited by both brief periods of limited food availability and systemic injection of cannabinoids. These similar effects on singing, combined with increasing evidence for endocannabinoid involvement in feeding behavior, led us to evaluate a possible shared mechanism. We found that limited food availability both reduces singing in a cannabinoid antagonist-reversible manner and increases levels of the endocannabinoid 2-arachidonyl glycerol in various brain regions including the caudal telencephalon, an area that contains auditory telencephalon including the L2 subfield of L (L2) and caudal medial nidopallium (NCM). Development and use of an anti-zebra finch cannabinoid receptor type 1 (CB1) antibody demonstrates distinct, dense cannabinoid receptor expression within song regions including Area X, lMAN (lateral magnocellular nucleus of anterior nidopallium), HVC, RA (robust nucleus of arcopallium), and L2. NCM receives L2 projections and is implicated in integration of auditory information. Activity in this area, determined through expression of the transcription factor ZENK, is increased after exposure to unfamiliar song. Because previous work has shown that these novel song-stimulated increases in NCM activity are mitigated by cannabinoid exposure, we tested and found that similar effects on ZENK expression are produced by limiting food. Limited food-related reductions in the activity of NCM neurons were reversed by the cannabinoid antagonist SR141716A (N-piperidino-5-(4-chlorophenyl)-1-(2,4-dichlorophenyl)-4-methylpyrazole-3-carboxamide), implicating CB1 cannabinoid receptor involvement. Taken together, these experiments indicate a link between feeding state and gene expression related to auditory perception that is mediated by endocannabinoid signaling.


Figures

Figure 1.
Figure 1.
Limited food availability reduces singing, an effect partially reversed by the cannabinoid antagonist SR141716A (SR). The methods described by Rashotte et al. (2001) were adapted. Food was limited for the first 4 hr of 14 hr light cycles. Song bout incidence was recorded over the 4 hr without food. Food was provided at the end of recording sessions. Three sessions were recorded on successive days, followed by 72 hr of ad libitum food access between treatments. Data for all three recording days were pooled before analysis. Shown are means ± SEM of total number of song bouts recorded (n = 4). Relationships between treatment and mean song bouts per hour produced were assessed with one-way ANOVA followed by SNK post-tests. *p < 0.001, difference from Food control; p < 0.001, difference from No Food group. The partial nature of SR reversal may indicate that the dosage (3 mg/kg) was submaximally effective (higher dosages were impractical). Cannabinoid antagonist reversal is consistent with endocannabinoid involvement. These behavioral results are in good agreement with limited food-related increased brain endocannabinoid levels (see Fig. 2).
Figure 4.
Figure 4.
Immunohistochemical staining of zebra finch telencephalon with anti-zebra finch CB1 receptor antibody. A-C, Medial parasagittal sections represent planes ∼0.15 mm lateral from the midline. D, E, More lateral parasagittal sections represent planes ∼1 mm from the midline. Rostral is left. Scale bar, 1 mm. Thirty-micrometer sections were incubated with affinity-purified primary antibody (1:3000), followed by HRP-conjugated secondary antibody and DAB staining. A, D, Staining produced with anti-zebra finch CB1 receptor antibody. A, Note distinct staining within L2 that projects to NCM, of a stripe within the rostral hyperpallium (H), the rostral tip of nidopallium (N), and in caudal hippocampus (Hp). Diffuse staining throughout the medial striatum (MSt) is consistent with distribution of CB1 receptor expression in mammalian species. B, Distinct staining is eliminated by preincubation of the antibody with 20 mm of the immunizing peptide. C, Camera lucida drawing indicates location of regions within the medial telencephalon. Black shading corresponds to distinct anti-zebra finch CB1 receptor staining. M, Mesopallium. D, Distinct CB1 receptor expression within the telencephalon. Note distinct staining of song regions including lMAN, Area X, L2, HVC, and RA. Additional regions with distinct labeling include a distinct region of the hyperpallium (HD), nucleus taeniae of the amygdala (TnA), and globus pallidus (GP). E, Camera lucida drawing indicates regions of distinct staining.
Figure 3.
Figure 3.
Specificity of anti-CB1 antibody labeling investigated through Western blotting. Comparison of Western blot results obtained with anti-rat and anti-zebra finch CB1 cannabinoid receptor antibodies is shown. Zebra finch whole-brain (ZF) and rat cerebellar homogenates (30 μg of protein each) were separated by 10% SDS-PAGE and blotted to nitrocellulose. The anti-rat antibody was generously provided by Dr. M. Elphick and is directed against the C-terminal, intracellular tail region of CB1. The zebra finch anti-CB1 antibody is also directed against the intracellular tail domain. A, Left, Staining of zebra finch (ZF) and rat brain protein with anti-rat CB1 antibody (1:8000). The two intense, high-molecular weight bands present in all blots (79.6 and 133 kDa) represent artifactual labeling of biotin-containing proteins by the streptavidin-alkaline phosphatase detection reagent used. These bands serve as an excellent loading control. Rat lane bands of ∼ 63.5, 50.4, and 34.7 kDa correspond to isoforms of CB1 as reported by Egertova and Elphick (2000). Note the lack of labeling of zebra finch proteins with the rat reagent. Right, Antibody labeling of rat CB1 isoforms is blocked by preincubation with 10 μg of the immunizing peptide. B, Labeling of zebra finch whole-brain protein with anti-zebra finch CB1 antibody (1:3000). A direct anti-rabbit peroxidase conjugate was used for detection avoiding streptavidin artifacts. Left, Labeling of zebra finch proteins corresponding in size to rat CB1 isoforms (compare with A). Notably, the ∼51 kDa isoform is either labeled less intensely by the zebra finch reagent or is less abundantly expressed within whole zebra finch brain relative to rat cerebellum. Right, Staining of zebra finch CB1 isoforms is eliminated by preincubation with 20 μm of the immunizing peptide.
Figure 2.
Figure 2.
Effect of food access on endogenous cannabinoid levels in zebra finch brain. Animals were either provided food ad libitum (Food) or subjected to 4 hr of limited food access (No Food), as described in Materials and Methods. Brains were rapidly dissected into rostral (Rostral Tel) and caudal (Caudal Tel) telencephalon, midbrain, and cerebellum. Lipids were extracted, spiked with deuterium-labeled internal standards, and subjected to LC-APCI-MS for quantitative analysis of 2-AG (A) and anandamide (B) content. ANOVA indicates a significant relationship between brain region and anandamide content (p < 0.05). Post hoc analysis reveals a significant increase in 2-AG content in the midbrain and rostral and caudal telencephalon (which contains auditory regions L2 and NCM) of animals subjected to limited food access (*p < 0.05).
Figure 5.
Figure 5.
Higher-power images of anti-zebra finch CB1 antibody staining in selected telencephalic regions. Thirty-micrometer parasagittal sections were incubated with affinity-purified primary antibody (1:3000), followed by HRP-conjugated secondary antibody and DAB staining. Scale bars, 50 μm. The boxes in 200× images indicate the location of corresponding 600× images. Intense staining of small somata and fibroid processes within L2, HVC, and RA contrast with less-intense labeling within the NCM. Intense staining within the song regions HVC and RA is consistent with distinct, high-level expression of mRNA encoding zebra finch CB1 receptors reported previously (Soderstrom and Johnson, 2000).
Figure 6.
Figure 6.
Example photomicrographs of anti-ZENK immunocytochemical staining within zebra finch NCM. Scale bars, 50 μm. Without novel song stimulation, ZENK expression was low across all food conditions (A, C, E, G). With ad libitum food access, novel song stimulation increased ZENK expression (compare A, B). Song-stimulated increased ZENK expression was to lower levels during limited food access (compare B, D). Limited food-associated decreased ZENK expression was reversed by the CB1-selective antagonist SR141716A, implicating endocannabinoid involvement (3 mg/kg, i.m., given 30 min before song exposure; D, H). SR141716A did not augment song-stimulated ZENK expression (F).
Figure 7.
Figure 7.
Quantification of ZENK-expressing cells per cubed millimeter of NCM. Groups of zebra finches were treated as indicated (see Materials and Methods), and tissue was prepared for immunocytochemical analysis of ZENK expression within the NCM. Exposure to novel song increases the number of ZENK-expressing cells (Song; indicated by *). These increases were significantly reduced by limited food access (No Food; indicated by †). This limited food access effect was reversed by pretreatment with the CB1 cannabinoid receptor-selective antagonist SR141716A (SR; 3 mg/kg, i.m.; indicated by ‡). No Song, No Food and SR, No Song, No Food controls did not significantly differ from No Song, Food. Group SR, Food, Song did not differ from group Food, Song.

References

    1. Berger A, Crozier G, Bisogno T, Cavaliere P, Innis S, Di Marzo V (2001) Anandamide and diet: inclusion of dietary arachidonate and docosahexaenoate leads to increased brain levels of the corresponding N-acylethanolamines in piglets. Proc Natl Acad Sci USA 98: 6402-6406. - PMC - PubMed
    1. Berry EM, Mechoulam R (2002) Tetrahydrocannabinol and endocannabinoids in feeding and appetite. Pharmacol Ther 95: 185-190. - PubMed
    1. Bonke BA, Bonke D, Scheich H (1979) Connectivity of the auditory forebrain nuclei in the guinea fowl (Numida meleagris). Cell Tissue Res 200: 101-121. - PubMed
    1. Chew SJ, Vicario DS, Nottebohm F (1996) A large-capacity memory system that recognizes the calls and songs of individual birds. Proc Natl Acad Sci USA 93: 1950-1955. - PMC - PubMed
    1. Clayton DF (2000) The genomic action potential. Neurobiol Learn Mem 74: 185-216. - PubMed

Publication types

MeSH terms

LinkOut - more resources