. 2004 Nov 3;24(44):10022-34.
doi: 10.1523/JNEUROSCI.2034-04.2004.

A novel epilepsy mutation in the sodium channel SCN1A identifies a cytoplasmic domain for beta subunit interaction

Affiliations

A novel epilepsy mutation in the sodium channel SCN1A identifies a cytoplasmic domain for beta subunit interaction

J Spampanato et al. J Neurosci. .

Abstract

A mutation in the sodium channel SCN1A was identified in a small Italian family with dominantly inherited generalized epilepsy with febrile seizures plus (GEFS+). The mutation, D1866Y, alters an evolutionarily conserved aspartate residue in the C-terminal cytoplasmic domain of the sodium channel alpha subunit. The mutation decreased modulation of the alpha subunit by beta1, which normally causes a negative shift in the voltage dependence of inactivation in oocytes. There was less of a shift with the mutant channel, resulting in a 10 mV difference between the wild-type and mutant channels in the presence of beta1. This shift increased the magnitude of the window current, which resulted in more persistent current during a voltage ramp. Computational analysis suggests that neurons expressing the mutant channels will fire an action potential with a shorter onset delay in response to a threshold current injection, and that they will fire multiple action potentials with a shorter interspike interval at a higher input stimulus. These results suggest a causal relationship between a positive shift in the voltage dependence of sodium channel inactivation and spontaneous seizure activity. Direct interaction between the cytoplasmic C-terminal domain of the wild-type alpha subunit with the beta1 or beta3 subunit was first demonstrated by yeast two-hybrid analysis. The SCN1A peptide K1846-R1886 is sufficient for beta subunit interaction. Coimmunoprecipitation from transfected mammalian cells confirmed the interaction between the C-terminal domains of the alpha and beta1 subunits. The D1866Y mutation weakens this interaction, demonstrating a novel molecular mechanism leading to seizure susceptibility.


Figures
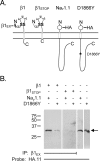
Figure 7.
Figure 7.
The cytoplasmic C-terminal domain of Nav1.1 interacts directly with β1, and the D1866Y mutation impairs that interaction. A, Structure of mammalian expression constructs containing the transmembrane segment and C-terminal domains of Nav1.1 or full-length β1. B, Lysates from Chinese hamster lung fibroblasts transfected with the constructs shown in A were immunoprecipitated with 5 μl of β1EX antibody specific for the extracellular domain of the β1 subunit. Immunoblots were probed with anti-HA.11 antibody (1:1000) directed toward the epitope tag on the Nav1.1 constructs. The untreated lysates in lanes 5 and 6 demonstrate equivalent expression of the wild-type and mutant Nav1.1 constructs in the transfected cells.
Figure 1.
Figure 1.
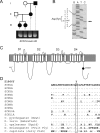
Identification of an SCN1A missense mutation in an Italian GEFS+ pedigree. A, DNA was obtained from four affected individuals in three generations. Conformation-sensitive gel electrophoresis of an internal fragment of exon 24 generated two bands from affected individuals. B, Sequence of exon 24 revealed heterozygosity for a G to T substitution that changes an aspartate residue to tyrosine (D1866Y). C, D1866Y is located in the C-terminal cytoplasmic domain of SCN1A. D, Evolutionary conservation of aspartate D1866. This residue is invariant in all members of the human gene family, SCN1A to SCN11A, and in homologous invertebrate sodium channels. GenBank accession numbers are from Escayg et al. (2001).
Figure 2.
Figure 2.
Voltage-dependent gating of wild-type Nav1.1 and D1866Y mutant channels in the absence and presence of the β1 subunit. A, The voltage dependence of activation was determined for the wild-type Nav1.1 (open symbols) and D1866Y (solid symbols) mutant channels expressed as α subunits alone (circles) or as α plus β1 (triangles). Sodium currents were recorded from a holding potential of -100 mV by a series of depolarizations to potentials between -95 and +50 mV in 5 mV increments. Normalized conductance values were calculated by dividing the peak current amplitudes by the driving force at each potential and normalizing to the maximum conductance. The values shown are means, and the error bars are SDs. The data were fit with a two-state Boltzmann equation, and the parameters of the fits are shown in Table 2. The voltage dependence of inactivation was determined for the wild-type Nav1.1 (open symbols) and D1866Y (solid symbols) mutant channels expressed as α subunits alone (squares) or as α plus β1 (diamonds). The voltage dependence of inactivation was determined using a two-step protocol in which a conditioning pulse was applied from a holding potential of -100 mV, consisting of 100 msec depolarizations to a range of potentials from -100 to +15 mV in 5 mV increments, followed by a test pulse to -5 mV. The peak current amplitude during each test pulse was normalized to the peak current amplitude during the first test pulse and plotted as a function of the conditioning pulse potential. The values shown are means, and the error bars are SDs. The data were fit with a two-state Boltzmann equation, and the parameters of the fits are shown in Table 2. B, A sample voltage protocol consisting of conditioning pulses to -100 and -40 mV (approximately the V1/2 of wild-type inactivation), followed by a test pulse to -5 mV. The corresponding normalized sodium currents recorded during the protocol are shown for Nav1.1 plus β1 and D1866Y plus β1. A comparison of the current amplitudes demonstrates that the mutant channel carried approximately twofold more current than the wild-type channel after a depolarization to -40 mV. C, Persistent current was recorded using a slow depolarizing voltage ramp of 15 mV per 200 msec applied from a holding potential of -100 to +50 mV. The traces shown are representative TTX-sensitive sodium currents resulting from the subtraction of currents recorded before and after application of 400 nm TTX. In each case, the peak ramp currents were normalized to the maximum peak sodium current for that oocyte. The average relative peak persistent currents recorded for each condition were as follows: Nav1.1 (n = 6), 0.045 ± 0.003; D1866Y (n = 5), 0.098 ± 0.009; Nav1.1 plus β1 (n = 8), 0.037 ± 0.007; D1866Y plus β1 (n = 8), 0.060 ± 0.006.
Figure 3.
Figure 3.
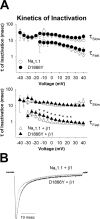
Kinetics of inactivation of wild-type Nav1.1 and D1866Y mutant channels in the absence and presence of the β1 subunit. A, Sodium currents were recorded from oocytes expressing wild-type Nav1.1 (open symbols) or D1866Y (solid symbols) mutant channels, as described in the legend to Figure 2. Current traces were fit with either a single-exponential or a double-exponential equation as described previously (Spampanato et al., 2003). The time constants for the fast (τfast) and slow (τslow) components of inactivation are plotted on a logarithmic scale in the top panel for α alone (circles) and in the bottom panel for α plus β1 (triangles). In all cases, the sum of the fraction of current inactivating with the τfast and τslow components is 1. This property did not differ between wild-type Nav1.1 and D1866Y mutant channels (data not shown). The values shown are means, and the error bars indicate SDs. B, Comparison of normalized current traces for the D1866Y mutant channels and the wild-type channels in the presence of the β1 subunit during a depolarization from -100 to -10 mV demonstrates the subtle delay in fast inactivation kinetics caused by the D1866Y mutation.
Figure 4.
Figure 4.
Recovery from fast inactivation and use dependence for wild-type Nav1.1 and D1866Y mutant channels. A, Recovery from inactivation was determined using three two-pulse protocols for wild-type Nav1.1 (open symbols) and D1866Y (solid symbols) mutant channels expressed as α subunits alone (circles) or α plus β1 (triangles). Each protocol was performed from a holding potential of -100 mV and consisted of a conditioning depolarization to -5 mV for 50 msec, a decreasing recovery time interval at -100 mV, and a test depolarization to -5 mV. The three protocols differed only in the maximum length of recovery time and the time interval by which that recovery period decreased. Fractional recovery, calculated by dividing the maximum current amplitude during the test pulse by the maximum current amplitude during the corresponding conditioning pulse, was plotted on a log scale as a function of the recovery time interval. The values shown are means, and the error bars are SDs. The data were fit with either a triple-exponential or a double-exponential equation, as described previously (Spampanato et al., 2003), and the parameters of the fits are shown in Table 3. B, Use dependence was analyzed at 39 Hz for wild-type Nav1.1 (open symbols) and D1866Y (solid symbols) mutant channels expressed as α subunits alone (circles) or α plus β1 (triangles). Currents were elicited by 17.5 msec depolarizations to -10 mV from a holding potential of -100 mV. The protocol was performed for 2.56 sec, by which time the current had reached equilibrium. Peak current amplitudes were normalized to the initial peak current amplitude and plotted against the start time of the corresponding depolarization in the pulse train. The values shown are means, and the error bars are SDs.
Figure 5.
Figure 5.
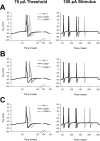
D1866Y mutant channels produce a hyperexcitable model neuron. The kinetics of the D1866Y mutant and wild-type Nav1.1 channels were defined using a conductance-based Hodgkin and Huxley model and the NEURON simulation software. The D1866Y mutant model neuron contained D1866Y mutant channels that differed from wild-type channels because of a positive shift in the voltage dependence of inactivation and delayed kinetics of inactivation, as shown in the previous figures. A, At a threshold stimulus (70 pA), the D1866Y mutant model neuron (black line) fired a single action potential with a shorter onset delay than the wild-type Nav1.1 model neuron (gray line). When the population of channels was mixed at a 1:1 ratio (D1866Y+/-; black dotted line), the mutant channels displayed a dominant effect, resulting in early generation of a single action potential. This effect is more pronounced at an increased stimulus intensity of 100 pA. B, When the delayed kinetics of the D1866Y mutation were modeled independently of the voltage dependence of inactivation (D1866Y-τ; black dotted line), the mutant model neuron fired an action potential at threshold with timing that was comparable with that of the wild-type Nav1.1 model neuron. When the stimulus intensity was increased to 100 pA, the D1866Y-τ model neuron continued to behave in a manner similar to the wild-type neuron, but it failed to fire a third action potential. C, Independent modeling of the positive shift in the voltage dependence of inactivation caused by the D1866Y mutation (D1866Y-V; black dotted line) demonstrated that this effect was sufficient to cause the early onset of an action potential at a threshold stimulus. When the stimulus intensity was increased to 100 pA, the D1866Y-V model neuron produced more rapid action potentials resulting in generation of an additional action potential.
Figure 6.
Figure 6.
The D1866Y mutant model neuron is resilient to subthreshold stimuli. Increasing duration subthreshold current injections of 60 pA were applied to wild-type Nav1.1 (gray traces), mutant D1866Y (black traces), and a 1:1 heterozygous population of mutant and wild-type (D1866Y+/-; dotted traces) model neurons. The conditioning depolarizations were immediately followed by injection of an additional 10 pA of current to test for action potential generation. Each plot begins with the application of the 60 pA conditioning pulse, and the arrows indicate the time point at which the additional 10 pA test injection was applied. The top panel shows a 0-msec-long conditioning pulse as a positive control. The D1866Y and D1866Y+/- model neurons fired single action potentials with shorter onset delays than for Nav1.1 after subthreshold stimuli up to 40 msec. In addition, the D1866Y and D1866Y+/- model neurons remained capable of firing action potentials after longer subthreshold stimuli, whereas the Nav1.1 model neurons did not fire action potentials after subthreshold stimuli of 60 msec or longer.

References

    1. Abou-Khalil B, Ge Q, Desai R, Ryther R, Bazyk A, Bailey R, Haines JL, Sutcliffe JS, George JR AL (2001) Partial and generalized epilepsy with febrile seizures plus and a novel SCN1A mutation. Neurology 57: 2265-2272. - PubMed
    1. Abriel H, Cabo C, Wehrens XHT, Rivolta I, Motoike HK, Memmi M, Napolitano C, Priori SG, Kass RS (2001) Novel arrhythmogenic mechanism revealed by a long-QT syndrome mutation in the cardiac Na+ channel. Circ Res 88: 740-745. - PubMed
    1. An R-H, Wang XL, Kerem B, Benhorin J, Medina A, Goldmit M, Kass RS (1998) Novel LQT-3 mutation affects Na+ channel activity through interactions between α- and β1-subunits. Circ Res 83: 141-146. - PubMed
    1. Annesi G, Gambardella A, Carrideo S, Incorpora G, Labate A, Pasqua AA, Civitelli D, Polizzi A, Annesi F, Spadafora P, Tarantino P, Cirò Candiano IC, Romeo N, De Marco EV, Ventura P, LePiane E, Zappia M, Aguglia U, Pavone L, Quattrone A (2003) Two novel SCN1A missense mutations in generalized epilepsy with febrile seizures plus. Epilepsia 44: 1257-1258. - PubMed
    1. Ausubel FM, Brent R, Kingston RE, Moore DD, Seidman JG, Smith JA, Struhl K (1987) Current protocols in molecular biology. New York: Greene and Wiley.

Publication types

MeSH terms

Associated data

LinkOut - more resources