. 2004 Nov 24;23(23):4679-89.
doi: 10.1038/sj.emboj.7600461. Epub 2004 Nov 4.

AIF deficiency compromises oxidative phosphorylation

Affiliations

AIF deficiency compromises oxidative phosphorylation

Nicola Vahsen et al. EMBO J. .

Abstract

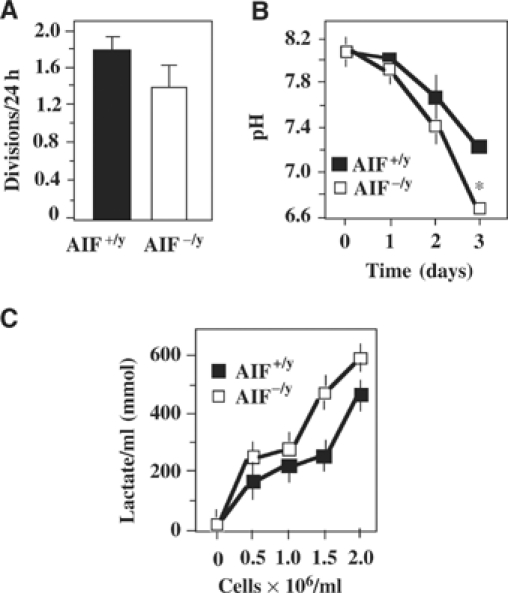
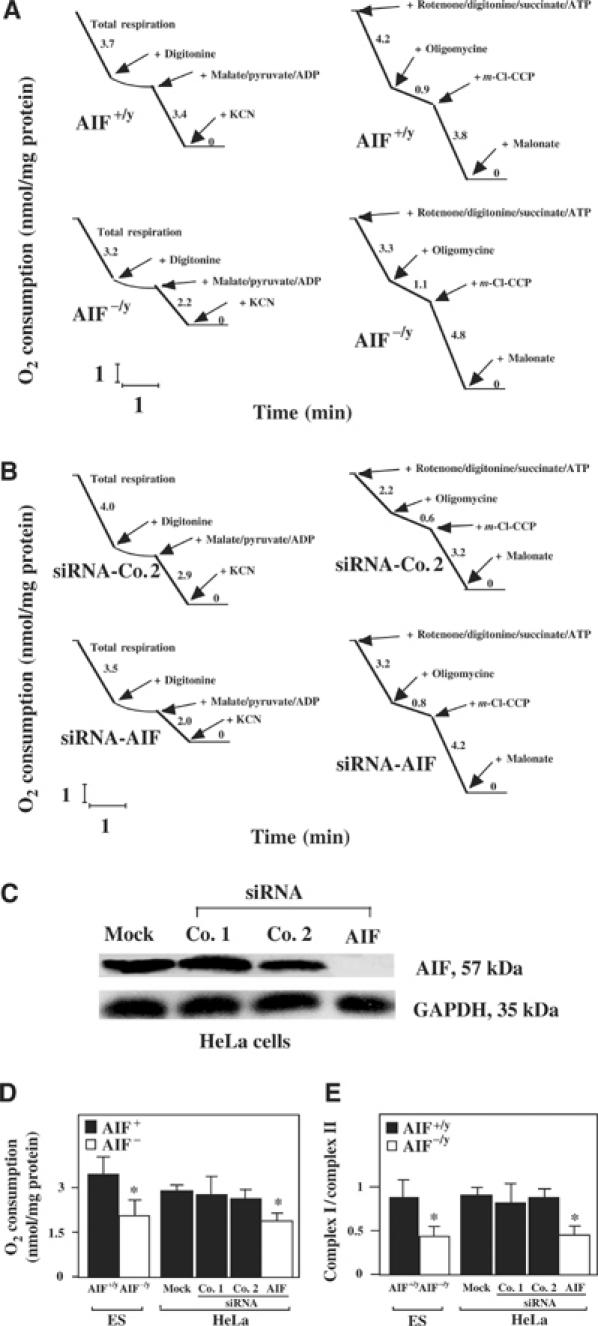
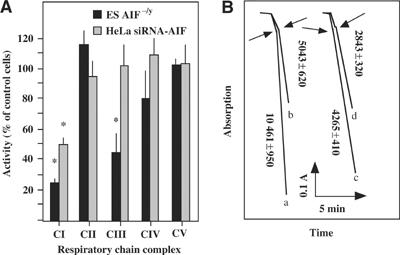
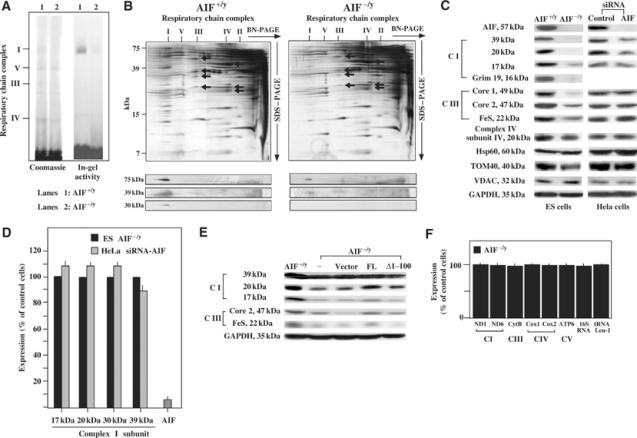
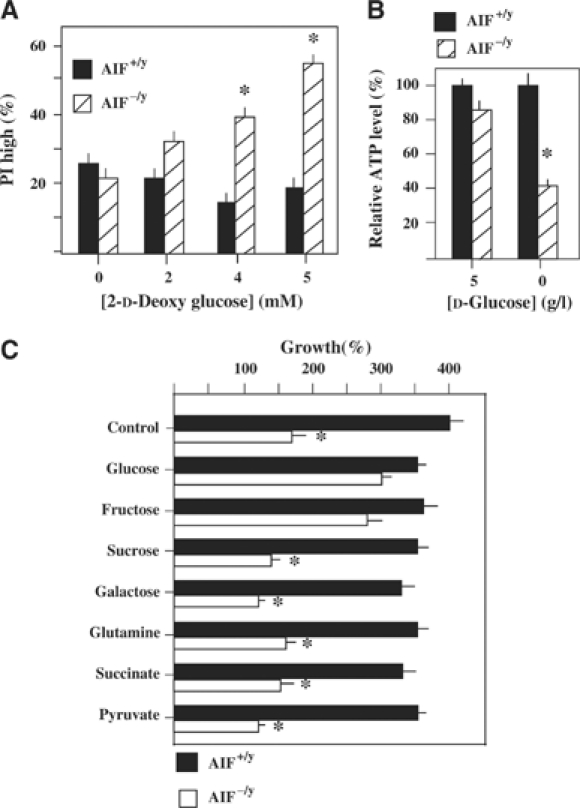
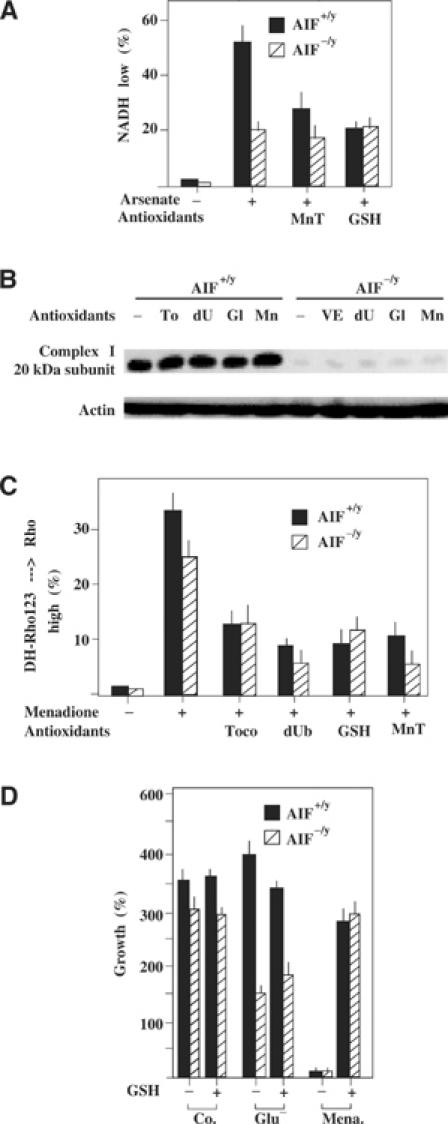
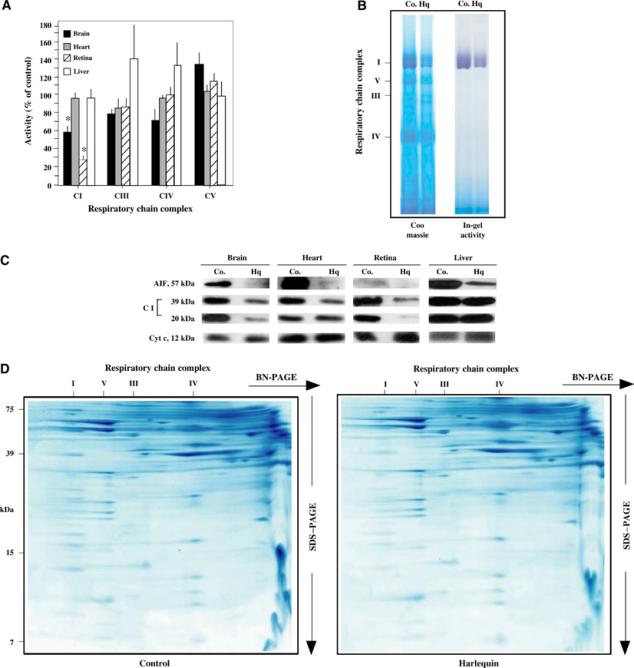
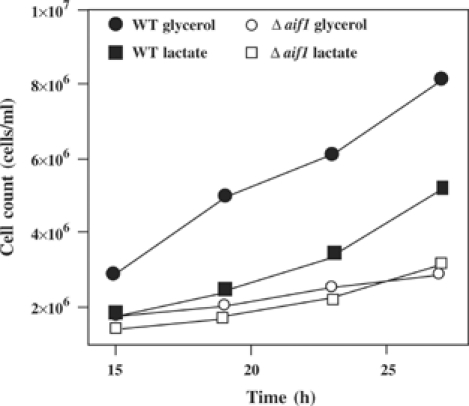
Apoptosis-inducing factor (AIF) is a mitochondrial flavoprotein that, after apoptosis induction, translocates to the nucleus where it participates in apoptotic chromatinolysis. Here, we show that human or mouse cells lacking AIF as a result of homologous recombination or small interfering RNA exhibit high lactate production and enhanced dependency on glycolytic ATP generation, due to severe reduction of respiratory chain complex I activity. Although AIF itself is not a part of complex I, AIF-deficient cells exhibit a reduced content of complex I and of its components, pointing to a role of AIF in the biogenesis and/or maintenance of this polyprotein complex. Harlequin mice with reduced AIF expression due to a retroviral insertion into the AIF gene also manifest a reduced oxidative phosphorylation (OXPHOS) in the retina and in the brain, correlating with reduced expression of complex I subunits, retinal degeneration, and neuronal defects. Altogether, these data point to a role of AIF in OXPHOS and emphasize the dual role of AIF in life and death.


Figures

Figure 1
Figure 1
Increased lactate production and decreased complex I activity in AIF-deficient cells. (A) Number of divisions per day of AIF−/y as compared to AIF+/y ES cells. Values are given as mean±s.d. (n=12). (B) Acidification of media by AIF−/y and AIF+/y cells, as determined in nonconfluent cultures (2.5 × 10⁵ cells/ml at day 0). (C) Lactate production by AIF−/y and AIF+/y ES cells, as evaluated at different densities (mean±s.e.m., n=3). Asterisks indicate significant (P<0.01, unpaired Student's t-test) differences between AIF−/y and AIF+/y cells.
Figure 2
Figure 2
OXPHOS deficiency in AIF-negative cells. (A) AIF−/y or AIF+/y ES cells were introduced into a polarograph to monitor their oxygen consumption, permeabilized with digitonin, followed by addition of the indicated respiratory substrates and inhibitors. The results are representative of three independent experiments. (B) Control HeLa cells or cells manipulated by siRNA to lose AIF expression were analyzed as in (A), yielding similar results in three experiments. (C) Suppression of AIF expression by siRNA. Cells were mock treated or transfected with two different control siRNAs or an AIF-specific siRNA, and the abundance of AIF was determined by immunoblot 72 h later. (D) Reduced absolute O2 consumption after addition of malate, pyruvate, and ADP. (E) Reduced pyruvate plus malate oxidation (as compared to succinate oxidation) after AIF knockout in ES cells or AIF knockdown with siRNA in HeLa cells, as determined by respirometry. Asterisks in (D, E) indicate significant (P<0.01) differences between AIF-deficient cells and their controls.
Figure 3
Figure 3
Respiratory chain complex activities in AIF-negative cells. (A) Measurements of isolated respiratory chain complexes. Mitochondrion-enriched fractions from AIF−/y, AIF+y ES cells or control siRNA and AIF siRNA HeLa cells were monitored for the activity of each of the respiratory chain complexes. Data (mean±s.d.) were ratioed to the AIF-positive controls, which were considered as 100% value. This experiment has been performed three times, in triplicate, with similar results. Asterisks denote a significant (P<0.01) AIF deficiency as compared to the control value (100%). (B) Reduced ferricyanide reduction in AIF-deficient ES and HeLa cells. As compared to ES control cells (trace a), AIF−/y ES cells (trace b) show a 50% decreased NADH-ferricyanide reductase activity. A 50% reduction of NADH-ferricyanide reductase activity was also observed in AIF siRNA HeLa cells (trace d) as compared to control HeLa cells (trace c), in three independent determinations. Arrows indicate addition of dodecylmaltoside.
Figure 4
Figure 4
Reduced abundance of complexes I and III. (A) BN-PAGE and in-gel activity of complex I measured on isolated mitochondria from AIF−/y or AIF+/y ES cells. Dodecylmaltoside was used for solubilization and separation of the mitochondrial complexes I, V, III, and IV (I, V, III, IV) by BN-PAGE. Densitometry (normalized to complex V) revealed a relative deficiency in AIF−/y cells, as far as the abundance of complex I (<30% of control AIF+/y value) and its in-gel activity are concerned (14% of control value), a reduced abundance of complex III (54% of control), and no defect in complex IV (84%) and complex V (100%). (B) Two-dimensional resolution of OXPHOS from AIF−/y or AIF+/y ES cells. Silver-stained 2D gels, as well as their immunodecoration with antibodies specific for three complex I subunits are shown. Complex III subunits (black arrows) are core protein II, the mitochondrially encoded cytochrome b, cytochrome c1, and the ‘Rieske' iron–sulfur protein, in the order of descending mass. Complex IV subunits (white arrows) are the mitochondrially encoded subunits COX I, II, and III. (C) SDS–PAGE determination of the subunit composition of complexes I and III using a number of monoclonal antibodies. Whole cell lysates from AIF−/y or AIF+/y ES and control or AIF siRNA (siRNA-AIF1) HeLa cells were subjected to immunoblot detection of the indicated antigens. This experiment has been reproduced five times. Data were confirmed for another ES knock-out cell line and additional siRNA controls (Supplementary Figure 2). (D) Expression of nuclear DNA-encoded complex II subunits in AIF-deficient cells, as determined by RT–PCR, normalized to 18S RNA. The values are given as percentage of the control (AIF+/y ES cells for AIF−/y ES cells and HeLa cells treated with emerin-specific siRNA for HeLa cells treated with AIF-specific siRNA). (E) Expression of AIF into AIF−/y ES restores complex I expression. Cells were transfected (efficiency 12±2%) with full-length (FL) AIF, Δ1–100 AIF (which lacks the mitochondrial targeting sequence), or empty vector, and 48 h later the expression of the indicated complex I and III subunits was monitored. (F) Expression of mitochondrial RNA in AIF-negative cells. Total cellular RNA was extracted from AIF+/y and AIF−/y ES cells, and the levels of the indicated RNA species (ND1, NADH dehydrogenase subunit 1; ND6, NADH dehydrogenase subunit 6; cytB, cytochrome b; cox1, Cyt c oxidase subunit 1; cox2, Cyt c oxidase subunit 2; ATP6, ATP synthase F0 subunit 6; 16S RNA; tRNA Leu-1, tRNA Leucine 1) encoded by mitochondrial DNA were quantified by RT–PCR. The results (mean±s.e.m., n=3) were expressed as percentage of control values (100% in AIF+/y ES cells).
Figure 5
Figure 5
Increased dependence of AIF-deficient cells on glycolysis. (A) Increased death of AIF-deficient cells after inhibition of glycolysis by 2-D-deoxyglucose. Cells (AIF−/y or AIF+/y) were cultured for 72 h in the absence or presence of 6 mM deoxyglucose, followed by staining with propidium iodide (PI) to determine the frequency of dead cells. (B) Reduced ATP production in AIF−/y cells upon glucose withdrawal. Cells were cultured for 36 h in the absence or presence of glucose, and ATP was determined among the adherent fraction of cells. (C) Reduced growth of AIF−/y cells in the absence of glucose. AIF−/y and AIF+/y cells were cultured for 3 days in the presence (5 g/l in C) or absence (Glu) of glucose, in the presence or absence of the indicated sugars or respiratory chain substrates (all at 5 mM), and the exact number of viable (DAPI) cells was determined by adding FITC-labeled beads as an internal standard of the FACS analysis. The results are means of three independent determinations (mean±s.d.) and asterisks mark significant (P<0.01) effects of the AIF deficiency.
Figure 6
Figure 6
Modulation of the redox consequences of the AIF defect. (A) Enhanced NAD(P)H depletion in AIF+/y as compared to AIF−/y cells in response to arsenate. Cells were treated with 1 mM arsenate for 6 h, in the presence or absence of GSH ester (5 mM) or MnTBAP (50 μM), followed by cytofluorometric determination of cellular NAD(P)H levels. (B, C) Failure of antioxidants to cause re-expression of the 20 kDa complex I subunit. AIF−/y and AIF+/y cells were cultured for 72 h in the presence of tocopherol (200 μM), decylubiquinone (50 μM), GSH ester (10 mM), or MnTBAP (50 μM), all re-added every 12 h, followed by immunoblot (B). Alternatively, cells were treated for 3 h with menadione (100 μM) and the production of ROS was measured by assessing the oxidation of dihydrorhodamine 123 in the cytofluorometer (C). (D) Failure of the antioxidant GSH to rescue AIF−/y cells from glucose withdrawal-induced cell death. AIF−/y and AIF+/y cells were cultured for 48 h in medium without glucose and/or 10 mM GSH ethyl ester, followed by determination of viability as in Figure 5C. As an internal control of the GSH effect, AIF+/y cells were also cultured in the presence of menadione (100 μM). The values are means±s.e.m. of three independent determinations.
Figure 7
Figure 7
AIF deficiency compromises complex I in vivo. (A) Respiratory chain complex activities in Harlequin mice. Mitochondria from AIFHQY or AIFWTY (Co.) tissues were monitored for the activity of each of the respiratory chain complexes. Data (mean±s.d.) were ratioed to the AIF-positive controls, which were considered as 100% value. Asterisks indicate a significant (P<0.01) respiratory defect, as determined in three independent experiments. (B) BN-PAGE analysis of Harlequin brains. Mitochondria from AIFHQY or AIFWTY brain were analyzed by BN-PAGE, followed by Coomassie staining or an in-gel assay of complex I activity. Densitometric analysis (normalized on complex V) indicated that HQ have 48±4% of complex I, 101±1% of complex III, and 97±3% of complex IV control values. The in-gel activity was reduced in exact proportion to the abundance of complex I. (C) Expression of respiratory chain complex subunits in Harlequin tissues. Mitochondria were subjected to immunoblot detection of AIF and the indicated complex I subunits. Cyt c served as a loading control. (D) Two-dimensional profiles of the respiratory chains from control and Harlequin brains. The analysis was performed as in Figure 4B.
Figure 8
Figure 8
Growth of aif1Δ yeast cells and isogenic controls in lactate or glycerol media. The results are representative of five experiments. No differences were found for growth in rich medium (not shown).

Similar articles

Cited by

References

    1. Arnoult D, Parone P, Martinou J-C, Antonsson B, Estaquier J, Ameisen JC (2002) Mitochondrial release of apoptosis inducing factor occurs downstream of cytochrome c release in response to several pro-apoptotic stimuli. J Cell Biol 59: 923–929 - PMC - PubMed
    1. Atorino L, Silvestri L, Koppen M, Cassina L, Ballabio A, Marconi R, Langer T, Casari G (2003) Loss of m-AAA protease in mitochondria causes complex I deficiency and increased sensitivity to oxidative stress in hereditary spastic paraplegia. J Cell Biol 163: 777–787 - PMC - PubMed
    1. Bénit P, Lebon S, Chol M, Giurgea I, Rötig A, Rustin P (2003) Mitochondrial NADH oxidation deficiency in humans. Curr Genomics 5: 137–146
    1. Budde SM, van den Heuvel LP, Smeets RJ, Skladal D, Mayr JA, Boelen C, Petruzzella V, Papa S, Smeitink JA (2003) Clinical heterogeneity in patients with mutations in the NDUFS4 gene of mitochondrial complex I. J Inherit Metab Dis 26: 813–815 - PubMed
    1. Budijardjo I, Oliver H, Lutter M, Luo X, Wang X (1999) Biochemical pathways of caspase activation during apoptosis. Annu Rev Cell Dev Biol 15: 269–290 - PubMed

Publication types

MeSH terms

LinkOut - more resources