. 2005 Jan 1;562(Pt 1):149-64.
doi: 10.1113/jphysiol.2004.075390. Epub 2004 Nov 4.

Layer-specific pyramidal cell oscillations evoked by tetanic stimulation in the rat hippocampal area CA1 in vitro and in vivo

Affiliations

Layer-specific pyramidal cell oscillations evoked by tetanic stimulation in the rat hippocampal area CA1 in vitro and in vivo

Martin Vreugdenhil et al. J Physiol. .

Abstract

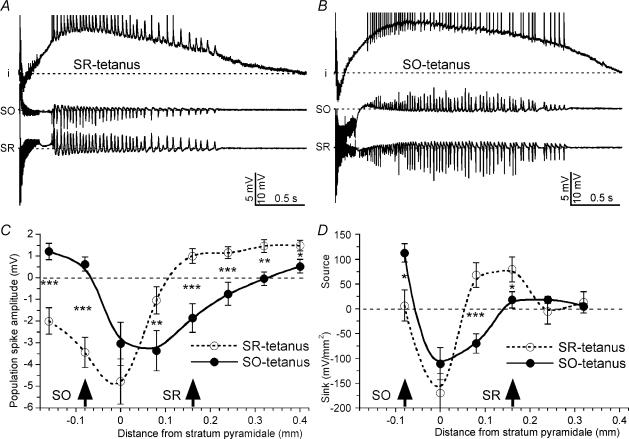
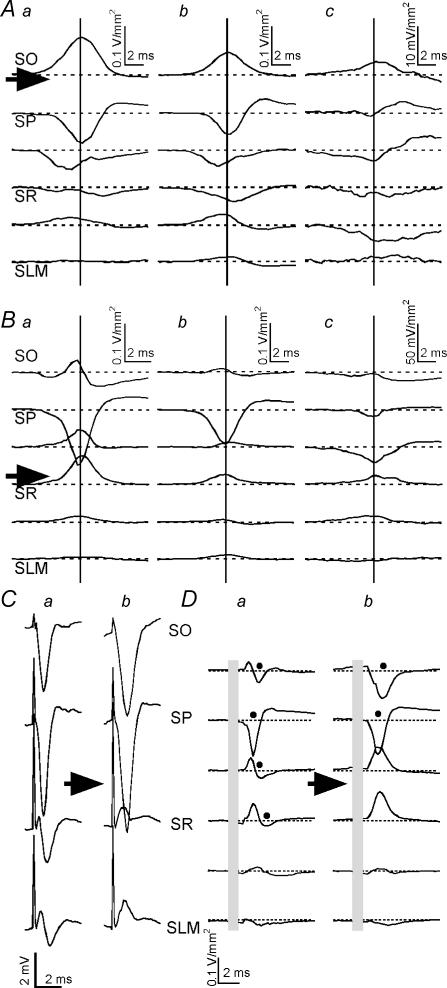
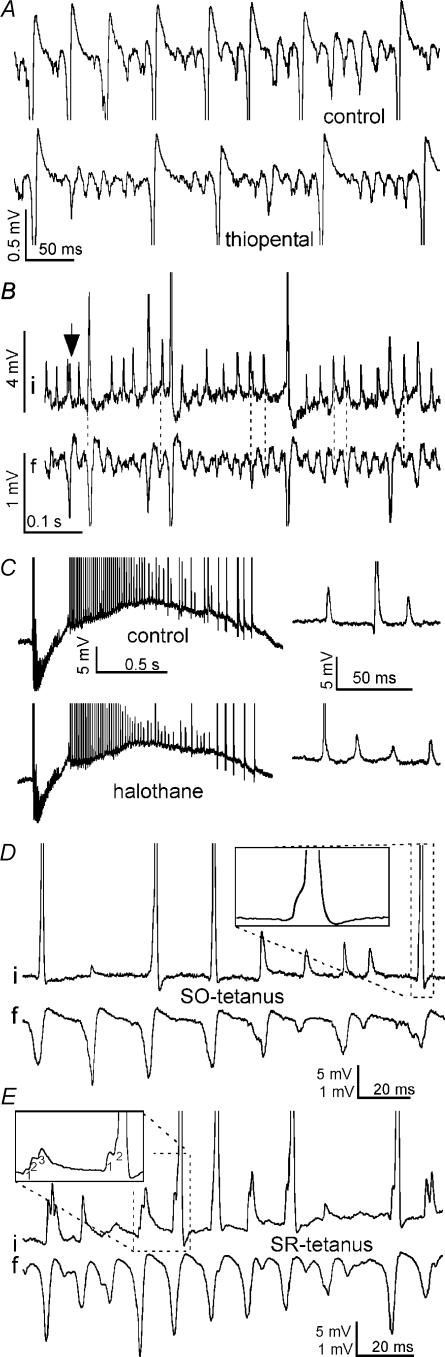
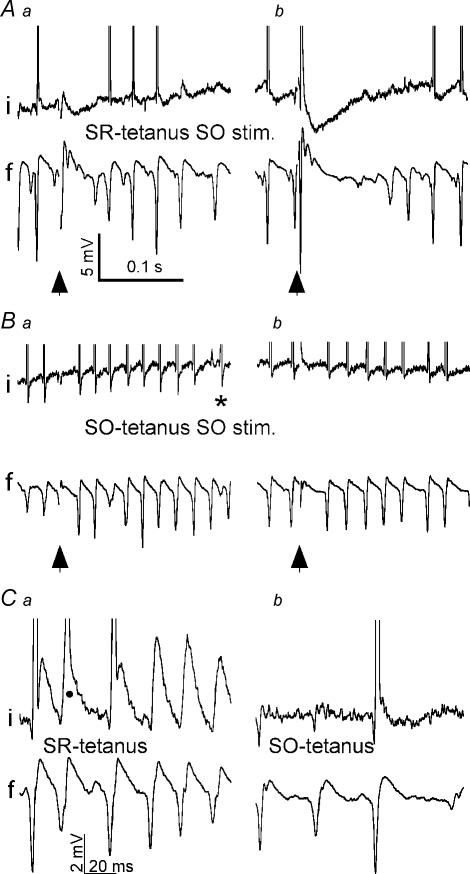
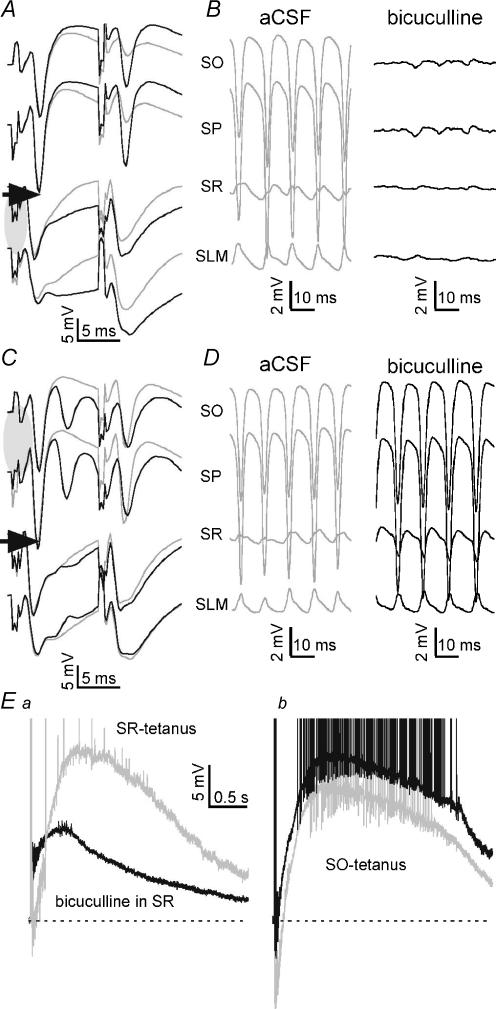
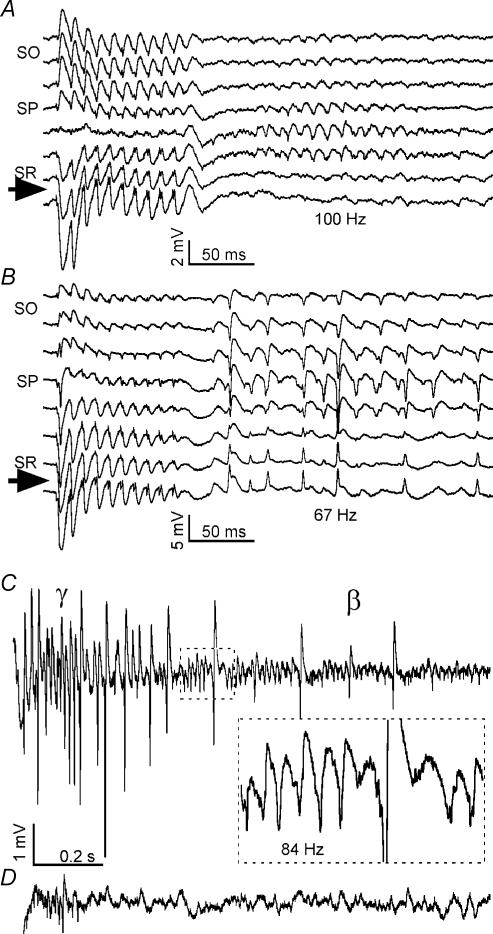
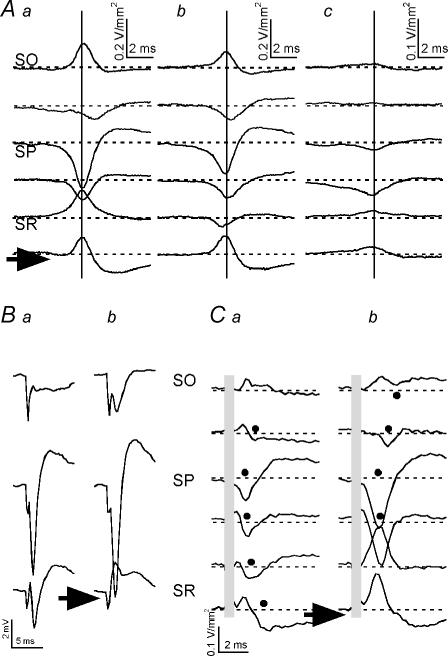
Tetanic stimulation of axons terminating in the CA1 region of the hippocampus induces oscillations in the gamma-to-beta frequency band (13-100 Hz) and can induce long-term potentiation (LTP). The rapid pyramidal cell discharge is driven by a mainly GABA(A)-receptor-mediated slow depolarization and entrained mainly through ephaptic interactions. This study tests whether cellular compartmentalization can explain how cells, despite severely reduced input resistance, can still fire briskly and have IPSPs superimposed on the slow GABAergic depolarization, and whether this behaviour occurs in vivo. Oscillations induced in CA1 in vitro by tetanic stimulation of the stratum radiatum or oriens were analysed using intracellular and multichannel field potentials along the cell axis. Layer-specific effects of focal application of bicuculline indicate that the GABAergic depolarization is concentrated on tetanized dendrites. Current-source density analysis and characteristics of partial spikes indicate that early action potentials are initiated in the proximal nontetanized dendrite but cannot invade the tetanized dendrite, where recurrent EPSPs and evoked IPSPs were largely suppressed. As the oscillation progresses, IPSPs recover and slow the neuronal firing to beta frequencies, with a small subpopulation of neurons continuing to fire at gamma frequency. Carbonic anhydrase dependence, threshold intensity, frequency, field strength and spike initiation/propagation of tetanus-evoked oscillations in urethane-anaesthetized rats, validate our observations in vitro, and show that these mechanisms operate in healthy tissue. However, the disrupted electrophysiology of the tetanized dendrites will disable normal information processing, has implications for LTP induction and is likely to play a role in pathological synchronization as found during epileptic discharges.


Figures

Figure 1
Figure 1. Spatial profile of tetanus-induced oscillations in vitro
An array of eight-wire electrodes centred 80 μm apart was placed perpendicular to the cell layer, 0.1 mm from the stimulus electrodes in the SR and SO. A, typical response to a 0.2 s 100 Hz tetanic stimulus at twice-threshold intensity fast oscillation threshold intensity applied to stratum radiatum (SR-tetanus). Extracellular field potential recordings electrodes in the SO (electrode position 80 μm from the SP) and SR (electrode position 160 μm from SP), shows an oscillation starting at frequencies in the gamma band (γ: 30–100 Hz), slowing down to beta (β: 10–30 Hz). Population spikes are negative in the SO and positive in the SR. Intracellular recording from a pyramidal neuron (i) shows a slow depolarization and cell firing that coincided with population spikes. B, the response of the same slice and cell to an SO-tetanus. The population spikes are now negative in the SR and positive in the SO, indicating that discharges take place in a different part of the cells from SR-tetani. C, the potential change recorded at all eight positions along the cell axis at the time to peak of the population spike in the SP given as a function of distance from the SP. Data are the mean of all population spikes during the interval 0.1–0.2 s after the start of the oscillation induced in eight slices by SR-tetani (○, dotted line) and by SO-tetani (, continuous line). Error bars indicate s.e.m. Paired t test significance levels are indicated as *, P < 0.05; **, P < 0.01; ***, P < 0.001. Arrows indicate the site of tetanic stimulation. D, one-dimensional current source density analysis at the time of the population spike peak in the SP. The tetanized dendrite provided the main source for the population spike-related sink. Symbols as in C.
Figure 2
Figure 2. Current-source density analysis of population spikes in vitro
An eight-wire array was placed perpendicular to the cell layer at 0.1 mm from the stimulus electrodes in the SR and SO. A third stimulus electrode was placed in the alveus >0.5 mm towards the subiculum for antidromic stimulation (20 V). Aa and b, one-dimensional current-source density–time plots of SO-tetanus-induced population spikes in the γ-phase (a) and β-phase (b). Data are the means of eight slices (five population spikes for each slice, time-locked at the time of the peak amplitude of the population spike in SP, indicated by vertical line). With large γ-phase population spikes (a) an active sink (associated with action potential generation) starts in the SR, propagates towards the SP and backpropagates to the SR (arrow marks the site of tetanic stimulation). The active sink with large population spikes in the β-phase (b) has shifted towards the soma. Ac, the mean current-source density-time plot of small γ frequency population spikes between the large population spikes during the β-phase (five spikes from six slices with clear miniature γ population spikes). The active sink is in the SP/SR border. Note the different scale in c. B, current-source density-time-plots for SR-tetanus-induced population spikes in the same slices as in A. Active sinks with large γ-phase population spikes (a) are found in the SO and SP, are confined to the SP with large population spikes in the β-phase (b) and include the proximal apical dendrite with small γ frequency population spikes in the β-phase (c). The miniature γ population spike sink is larger with SR-tetani than with SO-tetani. C, antidromic population spike evoked by single stimulation of the alveus, recorded simultaneously from the SO, SP, SR and stratum lacunosum/moleculare (SLM), before (a) and 0.2 s after (b) an SR-tetanus. D, one-dimensional current-source density–time plot of the antidromic population spike before (a) and 0.2 s after an SR-tetanus (b). Data are means of eight slices. Discharge-related current sinks (approximate sink onset indicated with •) were present deep into the apical dendrite in control conditions (a) but were restricted to nontetanized layers after a tetanus (b). Stimulus artefact was covered.
Figure 3
Figure 3. Miniature γ population spikes and spikelets
A, field potential recordings of an SR-tetanus-induced oscillation in control solution (top trace) shows small-amplitude population spikes that run at γ frequency during the β-phase. The same slice in the presence of 20 μm thiopental (bottom trace) showed that the frequency of these miniature γ population spikes is not reduced by increasing the IPSC time-constant, whereas the frequency of the large population spikes is reduced. B, spikelets occurring at γ frequency during the β-phase recorded in a pyramidal neuron (i) in response to an SR-tetanus coincide with miniature γ population spikes in the field (f). Full-sized action potentials are generated with large population spikes at β frequency. Arrow points to a spikelet doublet. C, spikelets are resistant to the gap junction blocker halothane. The slow depolarization recorded in a cell before (top traces) and after (bottom traces) 20 min in the presence of 10 mm halothane. Insets give detail of spikelets near the peak depolarization. Halothane had no consistent effect on the slow depolarization and left spikelets unaffected. Note that full-blown action potentials resume upon repolarization. D, partial spikes or spikelets of varying amplitude recorded in a pyramidal cell (i) in response to an SO-tetanus coincide with population spikes in the field potential (f) recorded in SP in the presence of 10 mm halothane. Spikelets suggest action potential generation in a cell compartment remote from the recorded soma. Inset shows spikelet as a shoulder in the action potential upstroke. E, spikelet doublets and triplets recorded in the same cell as in D in response to an SR-tetanus. Short (< 2 ms) interspike intervals lead to additive responses that can trigger an action potential. The interspike interval and relative amplitude of individual spikelets was variable. Note that the second spikelet in the enlarged triplet is larger than the first one.
Figure 4
Figure 4. Distribution of phasic synaptic potentials over cell axis
A, intracellular (i) and field potential recording (f) of the response to a single stimulus applied in the SO 0.2 s (a) and 0.6 s (b) after an SR-tetanus (arrows indicate time of stimulation). Synaptic potentials evoked at the nontetanized dendrites were initially severely reduced (a) but recovered partially as the oscillation progressed (b, see Table 1) to the extent that they could interrupt the rhythm. Stimulus artefacts are omitted (1 ms duration). B, the response to SO stimulations after an SO-tetanus in the same cell/slice as in A, Synaptic potentials were strongly suppressed (a) and showed little recovery (b, see Table 1) when tetanized synapses were tested. The oscillation was not affected by the stimulation of the tetanized layer. Note that this cell can fire action potentials coinciding with miniature population spikes (*). C, intracellular (i) and field potential recording (f) of an oscillation made 0.5–0.6 s after an SR-tetanus (a) or an SO-tetanus (b). With SR-tetanus-evoked oscillations population spikes were followed by recurrent EPSPs in this cell. Occasionally recurrent EPSPs can trigger an action potential (•) when the cell does not fire with a population spike. With SO-tetanus-evoked oscillations recurrent EPSPs were absent in the same cell.
Figure 5
Figure 5. Slow GABAAergic conductance is concentrated on tetanized dendrite
AD, effect of focal application (location indicated with grey oval) of either bicuculline methiodide (0.2 m, black lines) or plain aCSF (grey lines) on paired-pulse (10 ms interval) evoked potentials and SR-tetanus-induced fast oscillations recorded in different layers in the same slice. Washout of the bicuculline effect was complete within 20 min. Arrow indicates the site of stimulation. Application of bicuculline in the SR reduced paired-pulse inhibition (A) and almost completely blocked the γ oscillation at 0.15 s after the tetanus (B). Application of bicuculline in the SO caused burst firing (C) and boosted the γ oscillation without effect on frequency (D). E, intracellular recording of a response of neuron to an SR-tetanus (a) or to an SO-tetanus (b) in control solution (grey lines) and after focal application of bicuculline to SR (black lines). Dashed line gives baseline membrane potential (−65 mV). Bicuculline abolished the initial hyperpolarization and strongly reduced the slow depolarization only if bicuculline was applied on the tetanized dendrite.
Figure 6
Figure 6. Fast oscillations in vivo
A 16-channel recording probe (electrodes centred 50 μm apart) was placed in the dorsal hippocampus of a urethane-anaesthetized rat, perpendicular to the CA1 cell layer, ∼0.2 mm from the stimulus electrodes in the SR and alveus. Eight adjacent channels straddling the SP were selected for recording. A, a response to an SR-tetanus (10-pulse 100 Hz; arrow) at threshold intensity. High-frequency γ oscillations are strongest in the proximal region of the SR. B, in the same rat a tetanus at twice-threshold intensity evoked large-amplitude population spikes at γ frequency. The polarity of the spontaneous population spikes reverses in the SR. C, response to an SR-tetanus in control conditions. Recording from the SP shows a rapid reduction of the frequency of large population spikes, whereas miniature population spikes run at γ frequency between the β beats (inset). D, 30 min after application of the carbonic anhydrase blocker acetazolamide (Na+ salt, 200 mg kg−1i.p.) the fast oscillation evoked as in C was largely suppressed. Scale bars as C.
Figure 7
Figure 7. Current-source density analysis of population spikes in vivo
Aa and b, current-source density–time plots of large population spikes evoked by SR-tetani in vivo. Data are mean of eight rats (four population spikes from each rat, time-locked at the time of the peak amplitude of the population spike in the SP, indicated by vertical line). With large γ-phase population spikes (a) an active sink starts in the SO, propagates towards the SP and returns to the SO, suggesting action potential initiation in the nontetanized dendrite and subsequent backpropagation of action potentials into (other) nontetanized dendrites. The active sink with large population spikes in the β-phase (b) shifts to the somatic layer. A late synaptic sink in the distal SR, is absent in slices (Fig. 1B) and may reflect more intact polysynaptic circuitry to the stratum lacunosum/moleculare. Note the scale difference with Fig. 1Ba and b. Ac, the mean current-source density–time plot of miniature γ population spikes in the β-phase (four spikes from seven rats with clear miniature γ population spikes). The sink is located perisomally, as in vitro (Fig.s 2Cc). B, antidromic population spike evoked by single stimulation of the alveus, recorded simultaneously from the SO, SP and SR, before (a) and 0.2 s after (b) an SR-tetanus (arrow marks the site of tetanic stimulation). C, the current-source density–time plot of an antidromic population spike, evoked by alveus stimulation before (a) and 0.2 s after an SR-tetanus (b). Whereas the discharge-related sink (approximate onset indicated with •) propagates mainly into the SR in control conditions, after an SR-tetanus the sink propagates into the SO and is unable to invade the SR. Data are means of four rats tested. Stimulus artefact is covered by the grey bar.

Similar articles

Cited by

References

    1. Amaral DG. Emerging principles of intrinsic hippocampal organization. Curr Opin Neurobiol. 1993;3:225–229. 10.1016/0959-4388(93)90214-J. - DOI - PubMed
    1. Ariav G, Polsky A, Schiller J. Submillisecond precision of the input-output transformation function mediated by fast sodium dendritic spikes in basal dendrites of CA1 pyramidal neurons. J Neurosci. 2003;23:7750–7758. - PMC - PubMed
    1. Autere AM, Lamsa K, Kaila K, Taira T. Synaptic activation of GABAA receptors induces neuronal uptake of Ca2+ in adult rat hippocampal slices. J Neurophysiol. 1999;81:811–816. - PubMed
    1. Avoli M, Psarropoulou C, Tancredi V, Fueta Y. On the synchronous activity induced by 4-aminopyridine in the CA3 subfield of juvenile rat hippocampus. J Neurophysiol. 1993;70:1018–1029. - PubMed
    1. Bikson M, Hahn PJ, Fox JE, Jefferys JG. Depolarization block of neurons during maintenance of electrographic seizures. J Neurophysiol. 2003;90:2402–2408. - PubMed

Publication types

MeSH terms