. 2005 Jan 15;562(Pt 2):347-65.
doi: 10.1113/jphysiol.2004.073882. Epub 2004 Nov 4.

Voltage-controlled Ca2+ release and entry flux in isolated adult muscle fibres of the mouse

Affiliations

Voltage-controlled Ca2+ release and entry flux in isolated adult muscle fibres of the mouse

D Ursu et al. J Physiol. .

Abstract

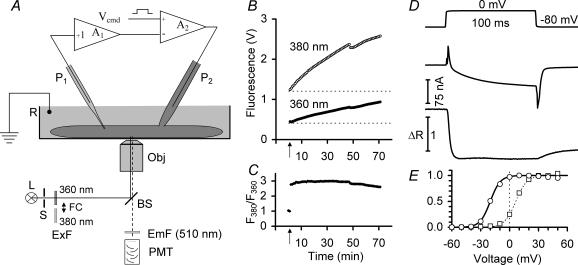
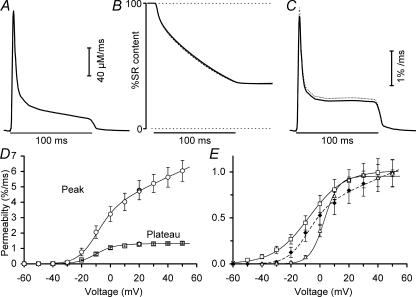
The voltage-activated fluxes of Ca(2+) from the sarcoplasmic reticulum (SR) and from the extracellular space were studied in skeletal muscle fibres of adult mice. Single fibres of the interosseus muscle were enzymatically isolated and voltage clamped using a two-electrode technique. The fibres were perfused from the current-passing micropipette with a solution containing 15 mm EGTA and 0.2 mm of either fura-2 or the faster, lower affinity indicator fura-FF. Electrical recordings in parallel with the fluorescence measurements allowed the estimation of intramembrane gating charge movements and transmembrane Ca(2+) inward current exhibiting half-maximal activation at -7.60 +/- 1.29 and 3.0 +/- 1.44 mV, respectively. The rate of Ca(2+) release from the SR was calculated after fitting the relaxation phases of fluorescence ratio signals with a kinetic model to quantify overall Ca(2+) removal. Results obtained with the two indicators were similar. Ca(2+) release was 2-3 orders of magnitude larger than the flux carried by the L-type Ca(2+) current. At maximal depolarization (+50 mV), release flux peaked at about 3 ms after the onset of the voltage pulse and then decayed in two distinct phases. The slower phase, most likely resulting from SR depletion, indicated a decrease in lumenal Ca(2+) content by about 80% within 100 ms. Unlike in frog fibres, the kinetics of the rapid phase of decay showed no dependence on the filling state of the SR and the results provide little evidence for a substantial increase of SR permeability on depletion. The approach described here promises insight into excitation-contraction coupling in future studies of genetically altered mice.


Figures

Figure 1
Figure 1. Experimental procedure to study Ca2+ signalling in mouse fibres
A, fluorescence emission was recorded from enzymatically isolated muscle fibres with a photomultiplier tube attached to the output port of an inverted fluorescence microscope. P1, voltage-recording intracellular micropipette filled with 3 m KCl; P2, current-passing electrode filled with internal solution containing the indicator dye; R, reference electrode; L, excitation light source; FC, filter changer; S, shutter; ExF, excitation filters; BS, beam splitter; EmF, emission filter; PMT, photomultiplier tube; A1, A2, voltage clamp amplifiers. B, loading of the fibre with fura-2 recorded by measuring the resting fluorescence F at 360 and 380 nm excitation (see Methods). Two fluorescence data points measured before start of perfusion (arrow) are outside the displayed voltage range. C, ratios of F380 and F360 after subtracting the extrapolated background fluorescence at time zero (dotted lines in B) from all measurement points, resulting in a mean free Ca2+ concentration of 46 nm.D, example of voltage clamp pulse (0 mV, 100 ms), L-type Ca2+ inward current and fura-2 fluorescence ratio signal (F380/F360). E, voltage dependence of activation of Ca2+ conductance (□) and Ca2+ signal (○) using more measurements of the experiment in D. Fit parameter values for description of current–voltage data (maximal Ca2+ conductance, reversal potential, voltage of half-maximal activation and steepness factor; for equations see Schuhmeier & Melzer, 2004): gCa,max = 186 S F−1, VCa = 73.2 mV, V1/2 = 6.8 mV, k = 5.2 mV; fit parameters for the fluorescence data: V1/2 =−15.2 mV, k = 5.5 mV. The interval between two consecutive recordings was 60 s.
Figure 2
Figure 2. Removal model fit and calculation of Ca2+ input flux
Fluorescence ratio signals (B) and calculated free Ca2+ signals (C) obtained with a train of four 50 ms pulses to 0 mV (A) separated by 150 ms intervals. Superimposed on the relaxation intervals after pulse repolarization in B are calculated ratio signals (thick lines) using the model of Schuhmeier & Melzer (2004). For best-fit parameters to calculate the model traces see list under E. D–E, calculation of Ca2+ input flux for a single step of voltage to 0 mV (D). Same experiment as in Fig. 1D and E. E, free Ca2+ concentration calculated for two different KDye values: 276 nm (continuous trace) and 1000 nm (dashed trace). Best-fit parameter values resulting from the two assumptions: koff,Dye = 33.9 s−1, kon,S = 18.5 μm−1 s−1, koff,S = 3.38 s−1, kuptake = 6591 s−1 and koff,Dye = 33.9 s−1, kon,S= 5.12 μm−1 s−1, koff,S= 3.38 s−1, kuptake= 1820 s−1, respectively. Initial values for fits in this and other experiments: koff,Dye= 30 s−1, kon,S= 1.5 μm−1 s−1, koff,S= 0.3 s−1 and kuptake= 1000 s−1 (Smith et al. 1984; Dietze et al. 1998; Schuhmeier & Melzer, 2004). Boundaries set for the parameters in the fitting algorithm were: 103 s−1, 104μm−1 s−1, 103 s−1 and 105 s−1, respectively. Only results that stayed within these limits without touching the boundaries for all four parameters were used here and elsewhere in this investigation. Fixed parameter values of the model used for the fit here and in all other fura-2 analyses: Rmin= 3.53, Rmax= 0.41, [Dye]total= 0.2 mm, [S]total= 15 mm and KDye=koff,Dye/kon,Dye= 0.276 μm (for equations see Schuhmeier & Melzer, 2004). F, calculated Ca2+ input fluxes for the two different assumptions in E leading to identical results. Note: flux amplitudes were scaled by 0.4 to account for smaller [Dye]total and [S]total in the cell (see Methods and Results).
Figure 3
Figure 3. Reproducibility of Ca2+ current and Ca2+ release to strong depolarization
Rectangular +20 mV voltage steps of 100 ms duration were applied with a frequency of 1 min−1. A, Ca2+ inward current. B, calculated Ca2+ input flux. The individual responses show only very small differences. Compared with the first pulse, the inward current amplitude for the last pulse was 8% larger and the peak release flux 9% smaller indicating almost full recovery from inactivation and depletion within 1 min intervals.
Figure 4
Figure 4. Comparison of Ca2+ entry and input fluxes
A, calculated Ca2+ entry fluxes (using eqn (2)). B, Ca2+ input fluxes calculated using the removal model fit procedure. Note that the absolute scales in panels A and B differ by a factor of almost 200 (same fibre as in Fig. 1D and E). C, peak (○) and plateau component (□) of Ca2+ input flux plotted as functions of voltage. Mean values from 8 experiments are shown. ⋄, measurements at +20 mV 1 min before and after the series of different voltage pulses indicating a small run-down in flux. Data were fitted by the product of a single Boltzmann function (1/(1 + exp((V1/2V)/k))) and a linear function (a + bV). The fit parameters V1/2, k, a and b had mean values of −10.27 ± 1.43 mV, 6.96 ± 0.24 mV, 129.51 ± 12.83 μm ms−1 and 885 ± 210 μm ms−1 V−1, respectively, for the peak and −14.23 ± 2.07 mV, 5.99 ± 0.22 mV, 22.46 ± 1.61 μm ms−1 and −81.1 ± 17.5 μm ms−1 V−1, respectively, for the plateau. The Ca2+ input flux calculations were based on a removal model with the following set of parameters: [fura-2]= 0.2 mm, [EGTA]= 15 mm, Rmin= 3.53, Rmax= 0.41, KDye= 276 nm, koff,Dye= 33.6 ± 2.9 s−1, kon,S= 24.5 ± 7.3 μm−1 s−1, koff,S= 4.32 ± 0.74 s−1, kuptake= 7.3 × 10³± 1.6 × 10³ s−1. The parameters koff,Dye, kon,S, koff,S and kuptake were optimized by the removal model fit procedure as described in Results. Fluxes were subsequently scaled by 0.4 to account for lower intracellular versus pipette concentrations (see Methods and Results). D, voltage dependence of Ca2+ entry flux derived from the leak-corrected Ca2+ inward current densities. Current data were fitted as described in Methods. The fit parameters gCa,max, VCa, V1/2 and k showed mean values of 112 ± 9 S F−1, 77.2 ± 5.45 mV, 3.0 ± 1.4 mV and 4.91 ± 0.24 mV, respectively. Current densities were scaled with the factor 22.5 μm s−1 A−1 F to obtain fluxes.
Figure 5
Figure 5. Voltage dependence of gating derived from fura-2 fluorescence analysis and membrane current measurements
Ca2+ input flux (A) obtained at +20 mV was analysed as described in Methods and converted to permeability to correct for the influence of depletion in the SR assuming that the quasi-linear slope in the plateau component is caused by a decrease in the lumenal Ca2+ concentration. B, fractional decrease of SR Ca2+ content calculated for the assumption of absence (continuous line) and presence of recycling (superimposed dotted line). The calculated initial SR Ca2+ concentrations (100% values) were 5.2 and 4.9 mm, respectively. C, SR Ca2+ permeability obtained as the result of the depletion correction. D, voltage dependence of permeabilities derived from the data of Fig. 4C. Values of the fit parameters V1/2, k, a and b (see legend of Fig. 4) were −11.32 ± 1.75 mV, 6.94 ± 0.4 mV, 3.92 ± 0.55% ms−1 and 43.08 ± 6.35% ms−1 V−1, respectively, for the peak, and −10.08 ± 2.27 mV, 6.38 ± 0.45 mV, 1.28 ± 0.10% ms−1 and 0.99 ± 1.3% ms−1 V−1, respectively, for the plateau. Estimated SR contents at +10, +20, +30, +40 and +50 mV were 3.44 ± 0.32, 3.28 ± 0.28, 3.17 ± 0.25, 3.06 ± 0.23 and 2.97 ± 0.22 mm, respectively. E, comparison of voltage dependence of intramembrane charge movements (□), peak release permeability (⋄, dashed line) and Ca2+ conductance (△), presented as fraction of the mean value obtained at +50 mV. Data from a subset of 6 experiments in which charge movements could be evaluated for a total of 8 fura-2 experiments. For charge movements, maximal value Qmax, V1/2 and k were 17.15 ± 2.51 nC μF−1, −7.6 ± 1.3 mV and 12.2 ± 0.7 mV, respectively. For release permeability, V1/2, k, a and b (see above) were −10.33 ± 2.10 mV, 7.24 ± 0.47 mV, 3.84 ± 0.74% ms−1 and 38.5 ± 7.5% ms−1 V−1, respectively. For conductance, gCa,max, V1/2 and k were 106 ± 9.7 S F−1, 2.15 ± 1.81 mV and 4.85 ± 0.32 mV, respectively.
Figure 6
Figure 6. Changes in SR Ca2+ content at different voltages
A, fractional SR Ca2+ content prior to depolarization (○) and fractional activation of Ca2+ release by the depolarization (⋄), normalized to the values at +50 mV. Subset of four fura-2 experiments in which the depletion analysis could be carried out even at low voltages. B, estimated fractional SR content after 100 ms of depolarization at the different voltages. Same experiments as in A.
Figure 7
Figure 7. Time course of voltage-activated Ca2+ release flux at different SR contents
A, calculated Ca2+ release fluxes for four consecutive pulses (for protocol see Fig. 2). B, normalized time courses of the traces in A. C, ratio of peak to end level of Ca2+ release fluxes as mean values from seven experiments like the one in A. D, calculated permeability changes for the trace in A using depletion analysis for each pulse separately. E, fractional SR content derived for the trace in A based on the depletion analysis of the first pulse (continuous line) and based on each individual depletion analysis (○). F, time constants of rapid inactivation of permeability for the four different traces in D. G, mean values of permeabilities of seven experiments (same analysis as in D, same experiments as in C). H, comparison of predicted (dark grey columns) and individually determined (light grey columns) SR contents as described in E, calculated for the seven experiments in G. I, mean time constants of rapid inactivation for the traces in G.
Figure 8
Figure 8. Calcium input flux and SR permeability calculated from fura-FF fluorescence ratio recordings
A, fura-FF fluorescence ratio recordings (F380/F360) obtained at four different voltages (−30, −10, +10 and +20 mV). As in the case of the fura-2 recordings (Fig. 1D) a decrease in the ratio indicates an increase in Ca2+ concentration. B, Ca2+ input flux obtained by removal model fitting as described in the text. Best-fit parameter values: koff,Dye= 170 s−1, kon,S= 7.3 μm−1 s−1, koff,S= 6.7 s−1 and kuptake= 3862 s−1. Fixed parameters here and in all other fura-FF analyses had the following values: Rmin= resting R (see Methods), Rmax= 1.5, [Dye]total= 0.2 mm, [S]total= 15 mm and KDye=koff,Dye/kon,Dye= 6.5 μm. As in fura-2 experiments, flux amplitudes were scaled by 0.4 to account for lower concentrations of [Dye]total and [S]total in the cell (see Methods and Results). C, peak (○) and plateau component (□) of Ca2+ input flux derived from six fura-FF experiments plotted as functions of voltage. Data were fitted as described in Fig. 4C. ⋄, measurements at +20 mV, 1 min before and after the series of test pulses indicating the degree of run-down in peak flux. The fit parameters V1/2, k, a and b had mean values of −8.03 ± 2.12 mV, 8.54 ± 0.53 mV, 212 ± 65.2 μm ms−1 and 0.12 ± 0.57 μm ms−1 V−1, respectively, for the peak, and −10.87 ± 2.18 mV, 7.48 ± 0.45 mV, 29.7 ± 4.04 μm ms−1 and 0.16 ± 0.04 μm ms−1 V−1, respectively, for the plateau. Estimated SR contents at +10, +20, +30, +40 and +50 mV were 7.77 ± 1.32, 5.98 ± 0.49, 6.46 ± 1.02, 5.6 ± 0.58 and 5.15 ± 0.51 mm, respectively. D, voltage dependence of the corresponding permeabilities derived from the data in C. Values of the fit parameters (see C) were −4.37 ± 4.07 mV, 9.92 ± 0.51 mV, 3.28 ± 0.77% ms−1 and 19.25 ± 12.09% ms−1 V−1, respectively, for the peak, and −7.99 ± 4.64 mV, 7.61 ± 0.68 mV, 0.678 ± 0.137% ms−1 and −0.64 ± 0.99% ms−1 V−1, respectively, for the plateau. The Ca2+ input flux calculations were based on a removal model with the following set of parameters: [fura-FF]= 0.2 mm, [EGTA]= 15 mm, Rmin= resting R, Rmax= 1.50, KDye= 6.5 μm, koff,Dye= 192 ± 30 s−1, kon,S= 11.0 ± 1.8 μm−1 s−1, koff,S= 4.94 ± 1.26 s−1, kuptake= 4.00 × 10³± 0.77 × 10³ s−1. The parameters koff,Dye, kon,S, koff,S and kuptake were optimized by the removal model fit procedure as described in Results.
Figure 9
Figure 9. Comparison of the time courses of calculated Ca2+ input fluxes and permeabilities derived from fura-2 and fura-FF recordings
Averaged traces of the calculated Ca2+ input flux at +20 mV depolarization obtained from 8 experiments performed with fura-2 as the indicator (A) and from 6 experiments performed with fura-FF (E). B and F, averaged traces of the depolarization-induced permeability changes derived from the data in A and E, respectively. Vertical scales were adjusted so that the sizes of the peaks match. Peak values were 147.01 ± 16.65 μm ms−1 (A), 207.93 ± 64.93 μm ms−1 (E), 4.78 ± 0.62% ms−1 (B) and 3.48 ± 0.93% ms−1 (F).Thin lines indicate s.e.m.C, voltage dependence of time-to-peak of input flux of the fura-2 experiments. The dashed line indicates delays caused by the Bessel filters used for command voltage rounding and signal smoothing. D, corresponding mean values of the peak-versus-plateau ratios of flux (□) and permeability (⋄). Note that peak and plateau were both measured from the baseline level. G, voltage dependence of time-to-peak of input flux for the fura-FF experiments. H, corresponding values of the peak-versus-plateau ratios of flux (□) and permeability (⋄).

Similar articles

Cited by

References

    1. Adams BA, Beam KG. Muscular dysgenesis in mice: a model system for studying excitation-contraction coupling. FASEB J. 1990;4:2809–2816. - PubMed
    1. Bakker AJ, Head SI, Stephenson DG. Time course of calcium transients derived from Fura-2 fluorescence measurements in single fast twitch fibres of adult mice and rat myotubes developing in primary culture. Cell Calcium. 1997;21:359–364. - PubMed
    1. Baylor SM, Chandler WK, Marshall MW. Sarcoplasmic reticulum calcium release in frog skeletal muscle fibres estimated from arsenazo III calcium transients. J Physiol. 1983;344:625–666. - PMC - PubMed
    1. Baylor SM, Hollingworth S. Fura-2 calcium transients in frog skeletal muscle fibres. J Physiol. 1988;403:151–192. - PMC - PubMed
    1. Baylor SM, Hollingworth S. Sarcoplasmic reticulum calcium release compared in slow-twitch and fast-twitch fibres of mouse muscle. J Physiol. 2003;551:125–138. - PMC - PubMed

Publication types