

Benthic and pelagic viral decay experiments: a model-based analysis and its applicability
- PMID: 15528537
- PMCID: PMC525182
- DOI: 10.1128/AEM.70.11.6706-6713.2004
Benthic and pelagic viral decay experiments: a model-based analysis and its applicability
Abstract
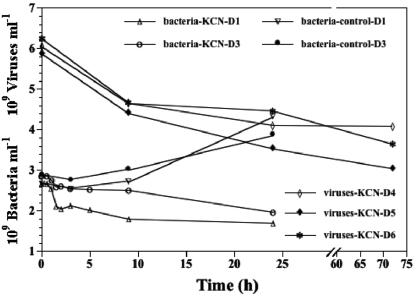
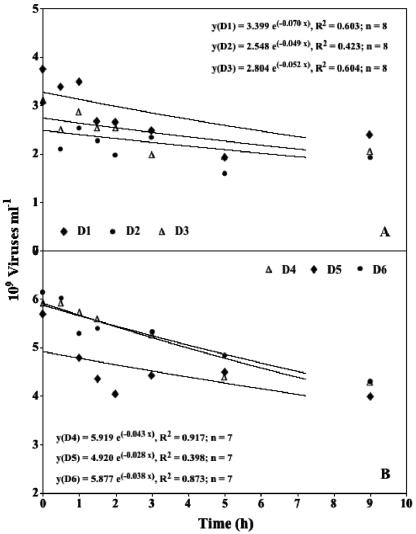
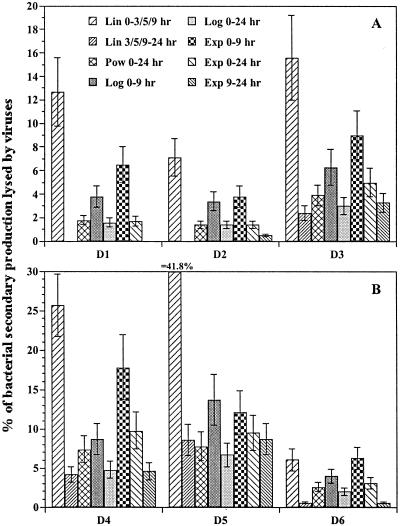
The viral decay in sediments, that is, the decrease in benthic viral concentration over time, was recorded after inhibiting the production of new viruses. Assuming that the viral abundance in an aquatic system remains constant and that viruses from lysed bacterial cells replace viruses lost by decay, the decay of viral particles can be used as a measure of viral production. Decay experiments showed that this approach is a useful tool to assess benthic viral production. However, the time course pattern of the decay experiments makes their interpretation difficult, regardless of whether viral decay is determined in the water column or in sediments. Different curve-fitting approaches (logarithmic function, power function, and linear regression) to describe the time course of decay experiments found in the literature are used in the present study and compared to a proposed "exponential decay" model based on the assumption that at any moment the decay is proportional to the amount of viruses present. Thus, an equation of the form dVA/dt = -k x VA leading to the time-integrated form VAt = VA0 x e(-k x t) was used, where k represents the viral decay rate (h(-1)), VAt is the viral abundance (viral particles ml(-1)) at time t (h), and VA0 is the initial viral abundance (viral particles ml(-1)). This approach represents the best solution for an accurate curve fitting based on a mathematical model for a realistic description of viral decay occurring in aquatic systems. Decay rates ranged from 0.0282 to 0.0696 h(-1) (mean, 0.0464 h(-1)). Additionally, a mathematical model is presented that enables the quantification of the viral control of bacterial production. The viral impact on bacteria based on decay rates calculated from the different mathematical approaches varied widely within one and the same decay experiment. A comparison of the viral control of bacterial production in different aquatic environments is, therefore, improper when different mathematical formulas are used to interpret viral decay experiments.
Figures
References
-
- Ackermann, H.-W., and M. S. DuBow. 1987. Viruses of prokaryotes. CPC Press, Boca Raton, Fla.
-
- Bratbak, G., M. Heldal, T. F. Thingstad, B. Riemann, and O. H. Haslund. 1992. Incorporation of viruses into the budget of microbial C-transfer. A first approach. Mar. Ecol. Prog. Ser. 83:273-280.
Publication types
MeSH terms
Substances
LinkOut - more resources
Full Text Sources
Research Materials
