

Visualization and exploratory analysis of epidemiologic data using a novel space time information system
- PMID: 15533253
- PMCID: PMC529462
- DOI: 10.1186/1476-072X-3-26
Visualization and exploratory analysis of epidemiologic data using a novel space time information system
Abstract
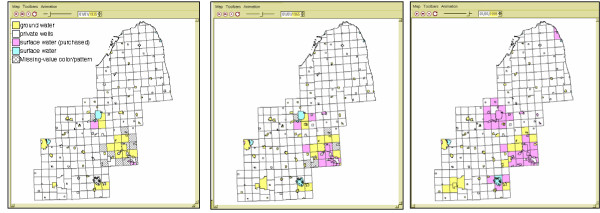
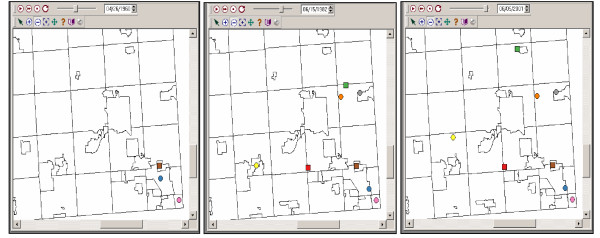
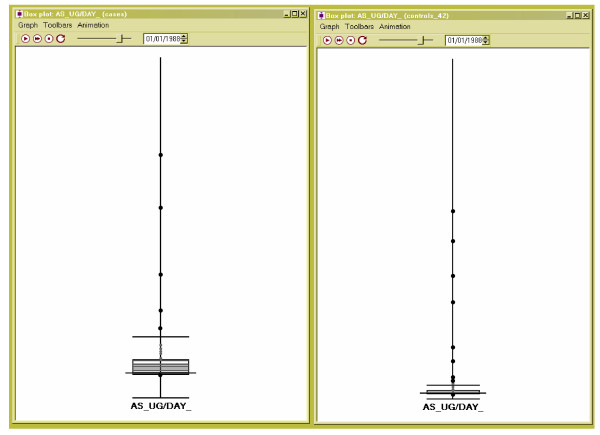
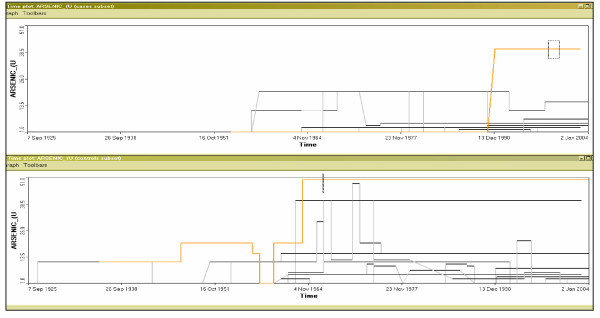
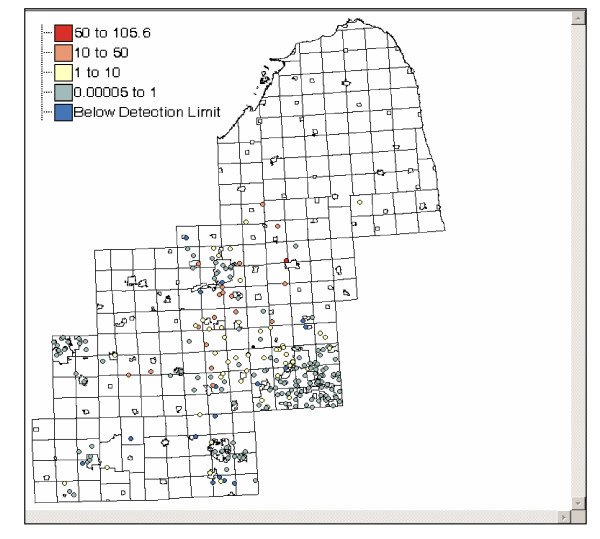
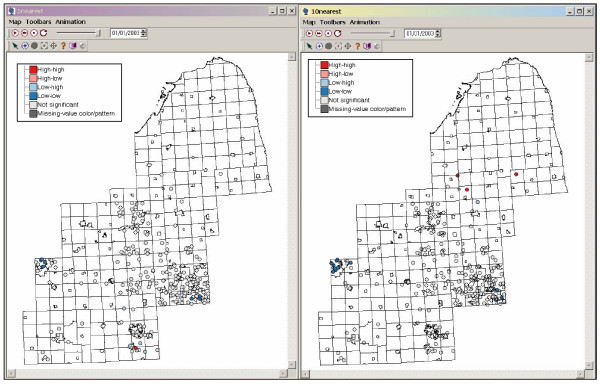
BACKGROUND: Recent years have seen an expansion in the use of Geographic Information Systems (GIS) in environmental health research. In this field GIS can be used to detect disease clustering, to analyze access to hospital emergency care, to predict environmental outbreaks, and to estimate exposure to toxic compounds. Despite these advances the inability of GIS to properly handle temporal information is increasingly recognised as a significant constraint. The effective representation and visualization of both spatial and temporal dimensions therefore is expected to significantly enhance our ability to undertake environmental health research using time-referenced geospatial data. Especially for diseases with long latency periods (such as cancer) the ability to represent, quantify and model individual exposure through time is a critical component of risk estimation. In response to this need a STIS - a Space Time Information System has been developed to visualize and analyze objects simultaneously through space and time. RESULTS: In this paper we present a "first use" of a STIS in a case-control study of the relationship between arsenic exposure and bladder cancer in south eastern Michigan. Individual arsenic exposure is reconstructed by incorporating spatiotemporal data including residential mobility and drinking water habits. The unique contribution of the STIS is its ability to visualize and analyze residential histories over different temporal scales. Participant information is viewed and statistically analyzed using dynamic views in which values of an attribute change through time. These views include tables, graphs (such as histograms and scatterplots), and maps. In addition, these views can be linked and synchronized for complex data exploration using cartographic brushing, statistical brushing, and animation. CONCLUSION: The STIS provides new and powerful ways to visualize and analyze how individual exposure and associated environmental variables change through time. We expect to see innovative space-time methods being utilized in future environmental health research now that the successful "first use" of a STIS in exposure reconstruction has been accomplished.
Figures
References
-
- Hazelton NWJ. PhD thesis. The University of Melbourne, Department of Surveying and Land Information; 1991. Integrating time, dynamic modeling and GIS: Development of four-dimensional GIS.
-
- Langran G. Time in Geographic Information Systems. London: Taylor and Francis; 1992.
-
- Mark D, PI, Bian L, Rogerson P, Vena J, Egenhofer M., PI "Spatio-Temporal GIS analysis for environmental health,". National Institute of Environmental Health Sciences, National Institutes of Health. R01 ES09816-01.
-
- Camossi E, Bertolotto M, Bertino E, Guerrini G. A Multigranular spatiotemporal data model. In Proceedings of the Eleventh ACM International Symposium on Advances in Geographic Information Systems: New Orleans, Louisiana, USA. November 7–8, 2003.
-
- Barnes S, Peck A. Mapping the future of health care: GIS applications in health care analysis. Geographic Information Systems. 1994;4:31–33.
Grants and funding
LinkOut - more resources
Full Text Sources
