. 2005 Feb;88(2):1377-86.
doi: 10.1529/biophysj.104.047308. Epub 2004 Nov 8.

Interpreting second-harmonic generation images of collagen I fibrils

Affiliations

Interpreting second-harmonic generation images of collagen I fibrils

Rebecca M Williams et al. Biophys J. 2005 Feb.

Abstract

Fibrillar collagen, being highly noncentrosymmetric, possesses a tremendous nonlinear susceptibility. As a result, second-harmonic generation (SHG) microscopy of collagen produces extremely bright and robust signals, providing an invaluable tool for imaging tissue structure with submicron resolution. Here we discuss fundamental principles governing SHG phase matching with the tightly focusing optics used in microscopy. Their application to collagen imaging yields several biophysical features characteristic of native collagen structure: SHG radiates from the shell of a collagen fibril, rather than from its bulk. This SHG shell may correspond to the supporting element of the fibril. Physiologically relevant changes in solution ionic strength alter the ratio of forward-to-backward propagating SHG, implying a resulting change in the SHG shell thickness. Fibrillogenesis can be resolved in immature tissue by directly imaging backward-propagating SHG. Such findings are crucial to the design and development of forthcoming diagnostic and research tools.


Figures

FIGURE 1
FIGURE 1
Diagram of coordinate system for calculating the SHG field at an observation point (R, θ, ϕ) from an arbitrary distribution of nonlinear scatterer within the focal volume. In this case, the nonlinear scatterer is distributed uniformly in a rod along the ŷ axis. In all SHG field-propagation calculations, the illumination incidence is directed along the + axis and the illumination polarization as well as induced nonlinear dipoles are assumed to be entirely ŷ-polarized.
FIGURE 2
FIGURE 2
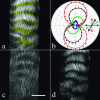
SHG polarization from individual fibers. (a) To determine the intrinsic fibril ρ, regions are selected in which fibrils are all oriented parallel to the fiber axis (yellow mask). (b) The SHG polarization intensity is measured from these regions by imaging with an analyzer placed between the specimen and the forward SHG detector. The curves displayed are from a linearly polarized fundamental at 0° (red), 30° (black), 60° (green), and 90° (blue) to the fiber axis (colored arrows). Note the differences in images acquired with an analyzer oriented parallel (c) and perpendicular (d) to the fiber axis. In this case, the SHG is induced with a fundamental that is polarized perpendicular to the fiber axis. Scale bar = 50 μm.
FIGURE 3
FIGURE 3
SHG emanates from the fibril shell only. (a and b) SHG from tendon is not significantly forward directed as shown by images of a 35-day tendon in the forward (a) and backward (b) directions. Absolute F/B is determined by normalization to F/B from 6-μm fluorescent beads, in which F/B ∼ 1. Shown in the inserts are F and B images of beads as compared to small rod-shaped glycine crystals, which clearly exhibit forward scattering. (c) F/B data from tendon suggest that the collagen fibril possesses a scatterer distribution more like a hollow tube than a solid rod. F/B data from fibrils of varying ages (circles), and thus varying diameters, are consistent with calculations (Eq. 7) of F/B from a thin shell (with a thickness <λ2ω/10, dashed line) rather than a solid rod (solid line). Each circle represents measurements from at least three tendons; error bars are too small to be visualized on the scale of this graph. The curves were calculated for a fibril centered in the focal spot; however, decentering the fibril had no significant effects on the curves. (d and e) High-resolution images reveal the hollow-tube appearance of resolvable fibrils (at arrowheads). An oblique projection (d) and a lateral cross section (e) acquired from adult tendons with a Zeiss 40 × 1.4 N.A. oil objective. (fh) The fibril diffraction pattern is consistent with SHG emanating from a hollow shell. To examine the SHG profile from a single fibril, a beam is focused at the indicated stationary location (X in f) in an adult tendon. The resulting diffraction pattern (g), imaged at the objective back aperture, matches that calculated for a thin hollow tube 0.25 μm in diameter (h). This experiment was carried out with a longer wavelength λω = 880 nm to ensure sensitivity of the camera to the SHG. The scale bars are 20, 2, 2, and 50 μm for b, d, e, and f, respectively.
FIGURE 4
FIGURE 4
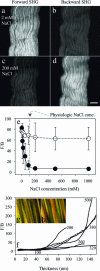
F/B values are dependent upon solution ionic strength as shown by the forward (a and c) and backward (b and d) images of an adult tendon at low (a and b) and high (c and d) NaCl concentrations. Scale bar = 50 μm. The dramatic decrease of F/B observed upon addition of salt (e; •) is suppressed in tendons initially paraformaldehyde fixed in water (e; ○). (f) Calculated F/B values from various diameter tubes (numbers indicating diameters are in nm) show a clear increase with shell thickness. For the 380-nm tube, a calculation is made with the tube centered within the focal volume (solid line) as well as off-centered by the radius of the tube (dotted line). High F/B values from fibrils in pure water are consistent with a swelling of the shell from which the SHG emanates. The insert images show images of fibrils immersed in 200 mM (g) and 2 mM NaCl (h). In this case, images in the forward and backward directions are both normalized to the same average value, the forward image is shown in green pseudocolor and the backward image is shown in red. As predicted for a distribution of fibril diameters, the fibrils in low salt show significant F/B variability (visualized as color variability), whereas those in high salt do not.
FIGURE 5
FIGURE 5
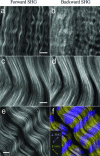
Immature fibril segments indicative of ongoing fibrillogenesis can be imaged in the backward direction. Fibril segments in a two-day tendon are more prominent in the backward image (b) than the forward image (a), whereas F and B images from mature tendon (c and d, respectively) are identical. (e) An image from a 19-day tendon collected in the forward direction shows mostly mature fibrils. (f) As indicated by their polarization, immature fibril segments are aligned to the fibril directionality. The backward-directed SHG is separated into two channels depending on the emission polarization (purple = perpendicular and yellow = parallel to the tendon axis as indicated by colored arrows). In the last case, the fundamental was polarized perpendicular to the tendon axis. All scale bars = 10 μm.

Similar articles

Cited by

References

    1. Baas, P. W., J. S. Deitch, M. M. Black, and G. A. Banker. 1988. Polarity orientation of microtubules in hippocampal neurons: uniformity in the axon and nonuniformity in the dendrite. Proc. Natl. Acad. Sci. USA. 85:8335–8339. - PMC - PubMed
    1. Barad, Y., H. Eisenberg, M. Horowitz, and Y. Silberberg. 1997. Nonlinear scanning laser microscopy by third harmonic generation. Appl. Phys. Lett. 70:922–924.
    1. Birk, D. E., and T. F. Linsenmayer. 1994. Collagen fibril assembly, deposition, and organization into tissue-specific matrices. In Extracellular Matrix Assembly and Structure. P. D. Yurchenco, D. E. Birk, and R. P. Mecham, editors. Academic Press, San Diego, CA. 91–128.
    1. Born, M., and E. Wolf. 1980. Principles of Optics. Pergamon Press, New York, NY.
    1. Boyd, R. W. 1992. Nonlinear Optics. Academic Press, Boston, MA.

Publication types

MeSH terms