Comparative Study
. 2005 Feb;88(2):805-17.
doi: 10.1529/biophysj.104.046821. Epub 2004 Nov 8.

Experimental validation of molecular dynamics simulations of lipid bilayers: a new approach

Affiliations
Comparative Study

Experimental validation of molecular dynamics simulations of lipid bilayers: a new approach

Ryan W Benz et al. Biophys J. 2005 Feb.

Abstract

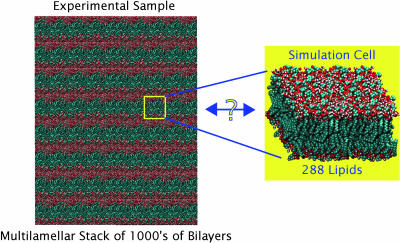
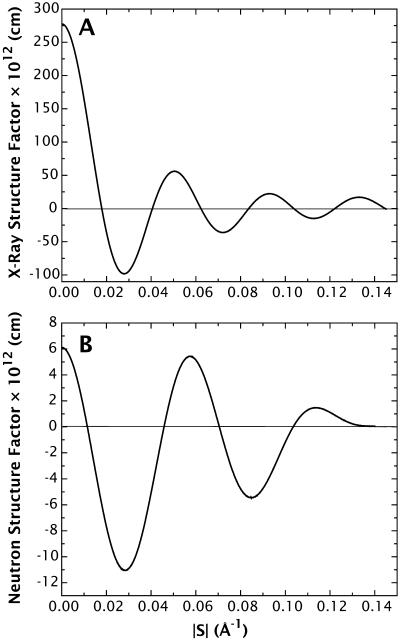
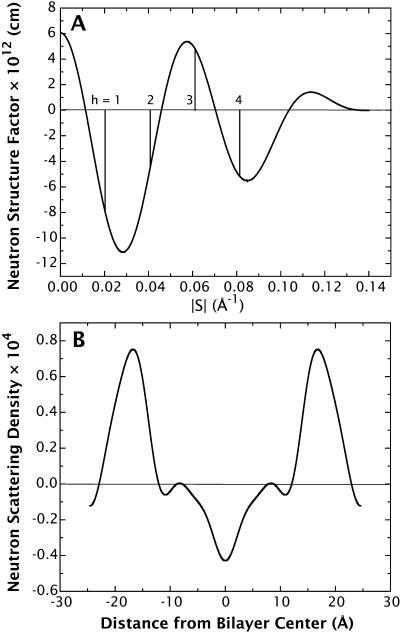
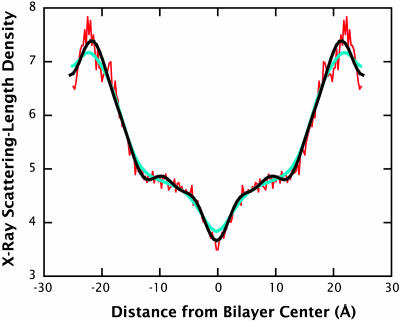
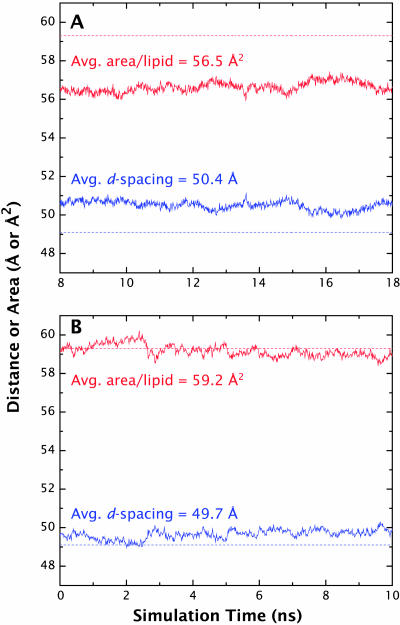
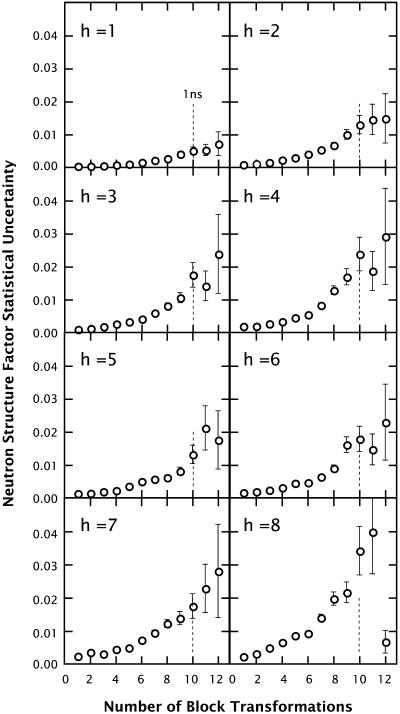
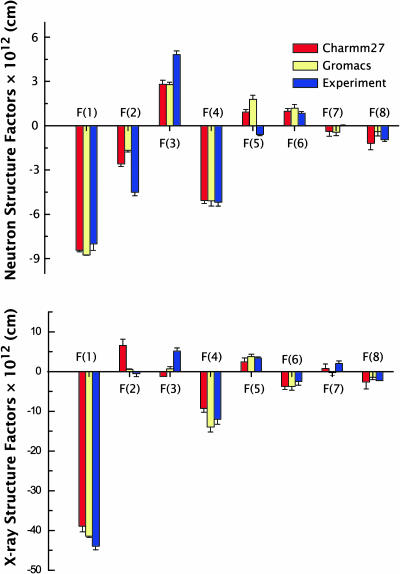
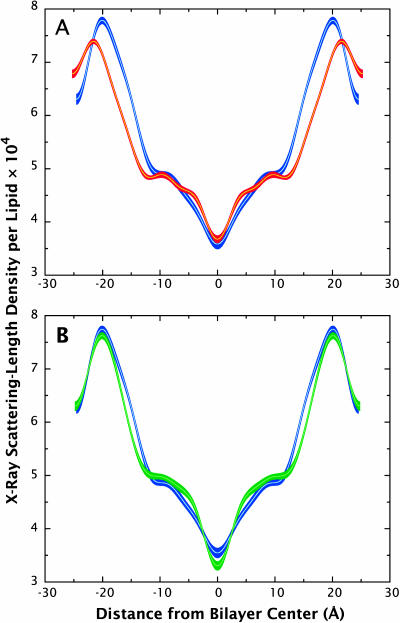
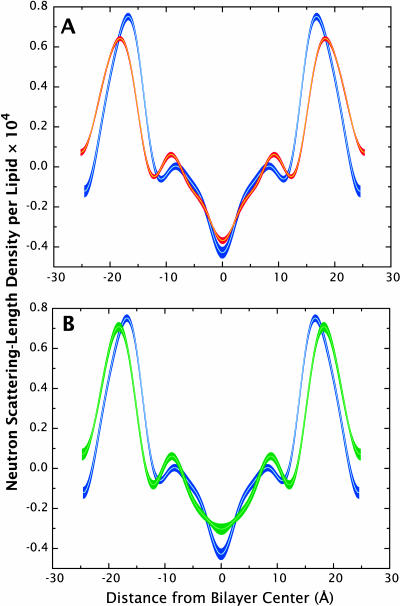
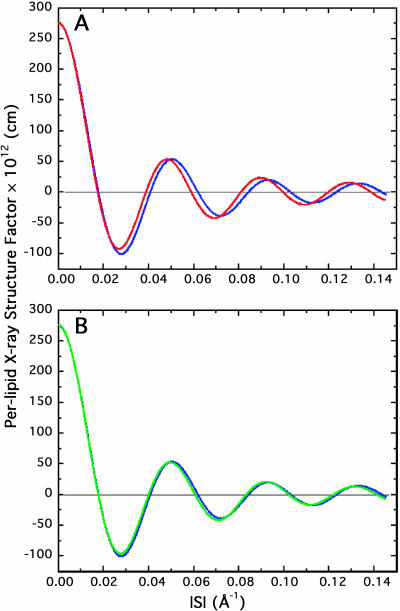
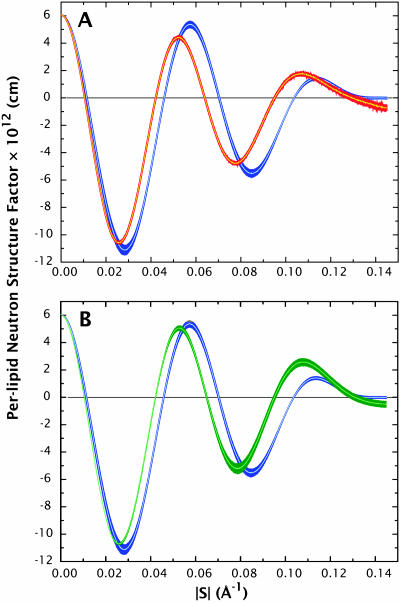
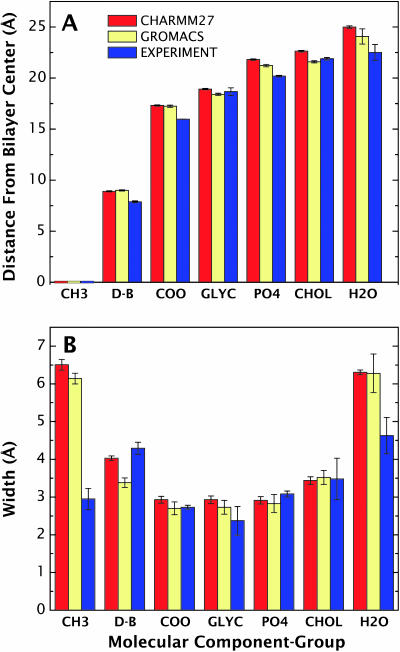
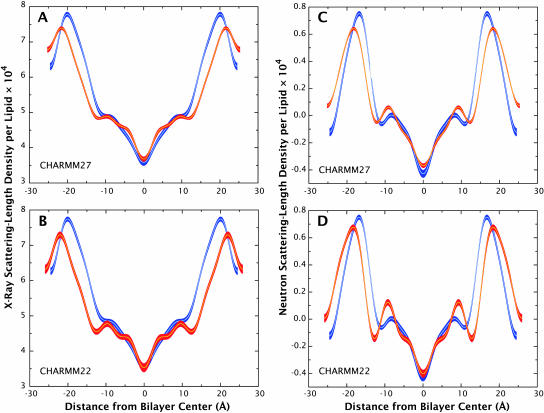
A novel protocol has been developed for comparing the structural properties of lipid bilayers determined by simulation with those determined by diffraction experiments, which makes it possible to test critically the ability of molecular dynamics simulations to reproduce experimental data. This model-independent method consists of analyzing data from molecular dynamics bilayer simulations in the same way as experimental data by determining the structure factors of the system and, via Fourier reconstruction, the overall transbilayer scattering-density profiles. Multi-nanosecond molecular dynamics simulations of a dioleoylphosphatidylcholine bilayer at 66% RH (5.4 waters/lipid) were performed in the constant pressure and temperature ensemble using the united-atom GROMACS and the all-atom CHARMM22/27 force fields with the GROMACS and NAMD software packages, respectively. The quality of the simulated bilayer structures was evaluated by comparing simulation with experimental results for bilayer thickness, area/lipid, individual molecular-component distributions, continuous and discrete structure factors, and overall scattering-density profiles. Neither the GROMACS nor the CHARMM22/27 simulations reproduced experimental data within experimental error. The widths of the simulated terminal methyl distributions showed a particularly strong disagreement with the experimentally observed distributions. A comparison of the older CHARMM22 with the newer CHARMM27 force fields shows that significant progress is being made in the development of atomic force fields for describing lipid bilayer systems empirically.


Figures

FIGURE 1
FIGURE 1
Illustration of the fundamental difference in scale between bilayer diffraction experiments and simulations. An experimental bilayer sample consists of thousands of bilayers measured over many hours or days, whereas a simulation cell typically contains hundreds of lipids simulated on the nanosecond timescale. These fundamental differences complicate comparisons between experiments and simulations. A fundamental question concerns how to compare lipid bilayer simulations, limited in both the time and spatial scales, to experiments performed on huge multibilayer systems.
FIGURE 2
FIGURE 2
Experimental x-ray (A) and neutron (B) continuous Fourier transforms of a DOPC bilayer at 5.4 H2O/lipid. The structure factors are computed on a per-lipid basis or the so-called relative absolute scale (Wiener and White, 1992b). These functions were obtained from the experimental structure factors reported in Table 1 of Wiener and White (1992b).
FIGURE 3
FIGURE 3
The relationship between the continuous Fourier transform of a single bilayer and its scattering-length density profile. (A) Experimental neutron continuous Fourier transform of the DOPC bilayer at 5.4 H2O/lipid (same as in Fig. 1 B), determined from the neutron structure factors reported in Table 1 of Wiener and White (1992b) and Eq. 10. Schematically, the vertical lines represent the perfect-lattice function that samples the continuous structure factor at multiples of the Bragg condition h/d. (B) Experimental neutron scattering-density profile corresponding to the continuous structure factor in A computed using Eq. 6.
FIGURE 4
FIGURE 4
X-ray scattering-length density profiles calculated for a DOPC bilayer at 5.4 waters/lipid by three different methods. Qualitatively, the profiles show the same general structural features, but they differ at the quantitative level. The profile in red was calculated assuming an electron density located at the atomic center of each atom, whereas the blue profile was calculated using a Gaussian electron distribution around each atom. The exact shape of the profile obtained by in this way depends on the width of the Gaussian chosen. Here we have used a half-width equal to the van der Waals radius of each atom. The profile in black was calculated by Fourier reconstruction of the set of structure factors calculated for this system. The advantage of this method is that no decision is required about how to smooth the profile, as in the Gaussian-smoothing case.
FIGURE 5
FIGURE 5
Evolution of the d-spacing (blue) and area/lipid (red) values for the simulations relative to the experimentally determined values. (A) The CHARMM27 simulation yielded an average d-spacing value of 50.4 Å, ∼1 Å above the experimental value of 49.1 Å and area/lipid of 56.5 Å2, which is below the experimental value of 59.3 Å2 by ∼3 Å2. (B) The d-spacing and area/lipid values for the GROMACS simulations are closer to the experimental values at 49.7 Å and 59.2 Å2, respectively.
FIGURE 6
FIGURE 6
Plots of the statistical uncertainties (standard deviations) for each computed neutron structure factor versus the number of blocking transformations, calculated using the method of Flyvbjerg and Petersen (1989). The molecular trajectories from the CHARMM27 simulation were used for computing the structure factors. The basic sampling interval used to derive these plots was 1 ps. Overall, the plots reveal a plateau at ∼210 transformations, corresponding to a correlation time of ∼1 ns (vertical dotted lines). Consequently, a collection of bilayer configurations for statistical analysis was constructed by sampling the bilayer configuration at 1-ns intervals (see text).
FIGURE 7
FIGURE 7
Comparisons of the simulated x-ray and neutron structure factors with the experimentally determined values (Tables 1 and 2). The uncertainties for the simulated structure factors correspond to the standard deviation of a set of structure factors computed at 1-ns intervals (see Fig. 6 and text). Overall, the most salient differences are observed in the second- and third-orders, particularly in the x-ray data.
FIGURE 8
FIGURE 8
Comparisons of x-ray scattering-density profiles for the CHARMM27 (red) and GROMACS (green) simulations with experimental profiles (blue). The scattering-length density profiles were constructed by inverting the structure factors calculated for the simulations from reciprocal space to real space. The line thickness for the profiles indicate the margin of error associated with the data/measurements. (A) The headgroup peaks in the CHARMM27 simulations are farther apart compared to the experimental values due in part to the larger average d-spacing of the simulation. The agreement of the profile is relatively good within the first 10 Å from the bilayer center, but becomes less accurate near the headgroup region. (B) The scattering-length density profile for the GROMACS simulation shows good agreement with the experimental data throughout the profile. The headgroup peaks are only slightly farther apart and the trough goes a bit deeper than the experimental profile.
FIGURE 9
FIGURE 9
Neutron scattering-length density profiles for the CHARMM27 (red) and GROMACS (green) simulations compared to experimental profiles (blue). Like the x-ray scattering-length density profiles, the neutron scattering-density profiles were constructed via structure-factor inversion to real space densities. The errors of the calculated data or experimental measurements are incorporated into the line thickness of the profiles. The CHARMM27 neutron scattering-density profile (A) again shows reasonable agreement with the experimental profile in the region within <10 Å of the bilayer center, but begins to deviate outside of this region. As in the x-ray density profile, a wider peak spacing is seen in the neutron profile as well. The GROMACS neutron density profile (B) also shows wider peak spacing and more pronounced shoulders compared to experiment.
FIGURE 10
FIGURE 10
X-ray continuous Fourier transforms for the CHARMM27 (red) and GROMACS (green) simulations versus experiment (blue). (A) The CHARMM27 continuous transform shows subtle but important deviations from the experimental transform. The simulation profile is shifted slightly to smaller wave vectors compared to the experimental profile, due in part to the larger d-spacing and headgroup-to-headgroup thickness associated with the simulation. (B) The same trend is observed with the GROMACS simulation, although agreement with the experiment is better, which is also evident in the scattering-length density profile. The subtle differences between the two simulated continuous transforms result in substantial differences in the real-space density profiles.
FIGURE 11
FIGURE 11
Neutron continuous Fourier transforms for the CHARMM27 (red) and GROMACS (green) simulations compared with experimental transforms (blue). (A) Again, the CHARMM27 simulation transform is right-shifted toward smaller wave-vectors. (B) The GROMACS neutron transform is also shifted to smaller wave-vectors depth and the height of the last peak is also noticeably larger than experiment.
FIGURE 12
FIGURE 12
Comparisons of the mean positions and widths of the molecular component groups in DOPC and water for the CHARMM27 and GROMACS simulations with experimentally determined values. (A) The CHARMM27 simulation mean positions are slightly better than the GROMACS values for the double bond, carbonyl, and glycerol groups, and slightly worse for the phosphate, choline, and water groups. (B) The differences between the simulations and experiments are more pronounced in the molecular component widths. The biggest difference is seen in the terminal methyl group of DOPC, where the simulation widths are nearly twice as large as the experimentally determined value. Such a difference suggests that additional experimental studies of this region of the bilayer are needed.
FIGURE 13
FIGURE 13
Comparison of x-ray and neutron density profiles of the CHARMM22 and CHARMM27 simulations (red) with experiment (blue). The x-ray density profile for the CHARMM27 simulation (A) shows better agreement with experiment compared to the CHARMM22 results (B). However, both simulations show a wider headgroup peak distance compared to the experimental profile. The CHARMM27 simulation (C) also shows better agreement for the CHARMM22 neutron density profile (D). The differences in the scattering-length density profiles from the CHARMM27 and CHARMM22 simulations are small, but given that the d-spacing and area/lipid values as well as the overall x-ray and neutron scattering-length density profiles are closer to experiment for the CHARMM27 simulation, this force field as a whole reproduced experimental results better than the older CHARMM22 force field.

References

    1. Allen, M. P., and D. J. Tildesley. 1987. Computer Simulation of Liquids. Oxford University Press, Oxford, UK.
    1. Berendsen, H. J. C., J. P. M. Postma, W. F. van Gunsteren, A. DiNola, and J. R. Haak. 1984. Molecular dynamics with coupling to an external bath. J. Chem. Phys. 81:3684–3690.
    1. Berendsen, H. J. C., D. van der Spoel, and R. van Drunen. 1995. GROMACS: a new message-passing parallel molecular dynamics implementation. Comp. Phys. Commun. 91:43–56.
    1. Berger, O., O. Edholm, and F. Jähnig. 1997. Molecular dynamics simulations of a fluid bilayer of dipalmitoylphosphatidylcholine at full hydration, constant pressure, and constant temperature. Biophys. J. 72:2002–2013. - PMC - PubMed
    1. Chiu, S. W., E. Jakobsson, S. Subramaniam, and H. L. Scott. 1999. Combined Monte Carlo and molecular dynamics simulation of fully hydrated dioleyl and palmitoyl-oleyl phosphatidylcholine lipid bilayers. Biophys. J. 77:2462–2469. - PMC - PubMed

Publication types