. 2004 Nov 8;167(3):505-18.
doi: 10.1083/jcb.200406177.

Localized Ras signaling at the leading edge regulates PI3K, cell polarity, and directional cell movement

Affiliations

Localized Ras signaling at the leading edge regulates PI3K, cell polarity, and directional cell movement

Atsuo T Sasaki et al. J Cell Biol. .

Abstract

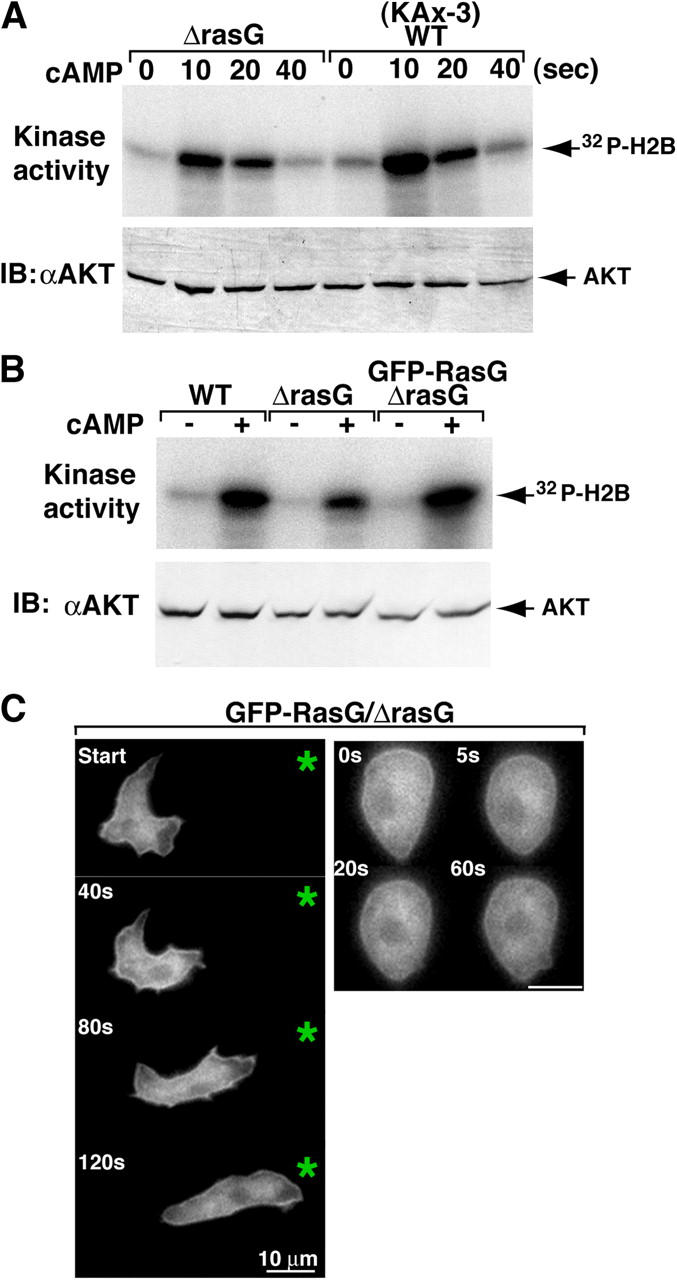
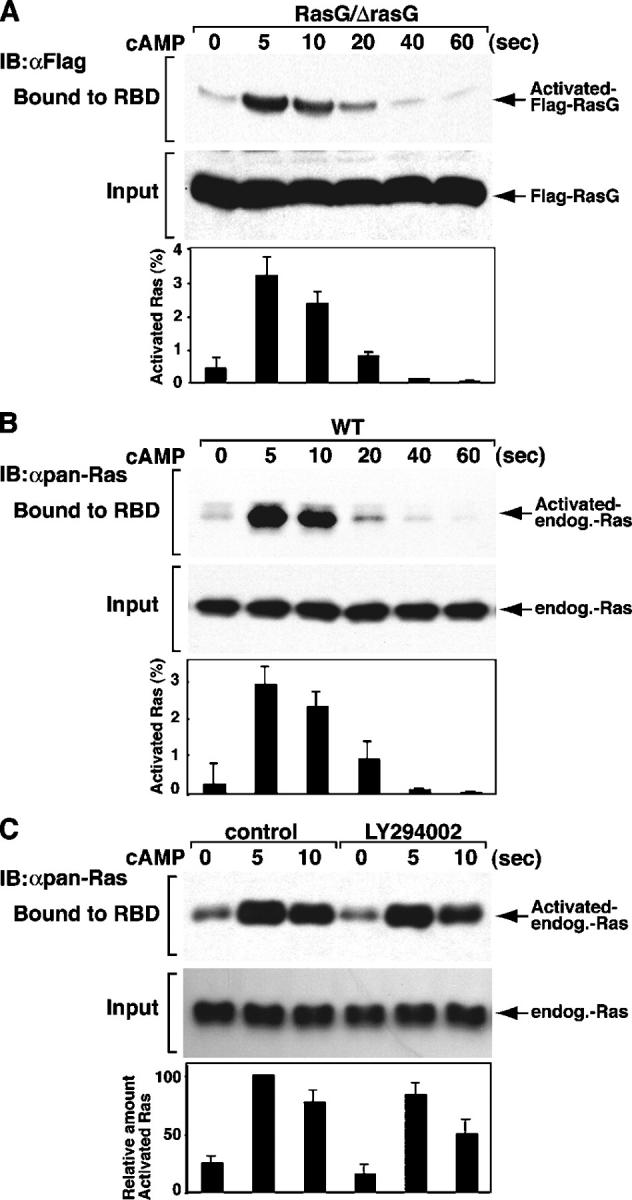
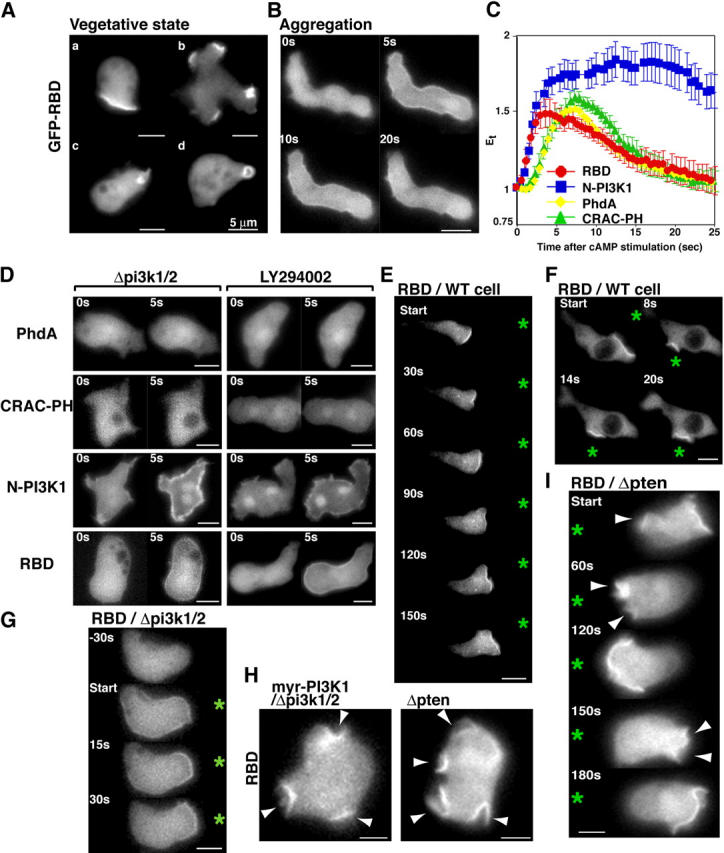
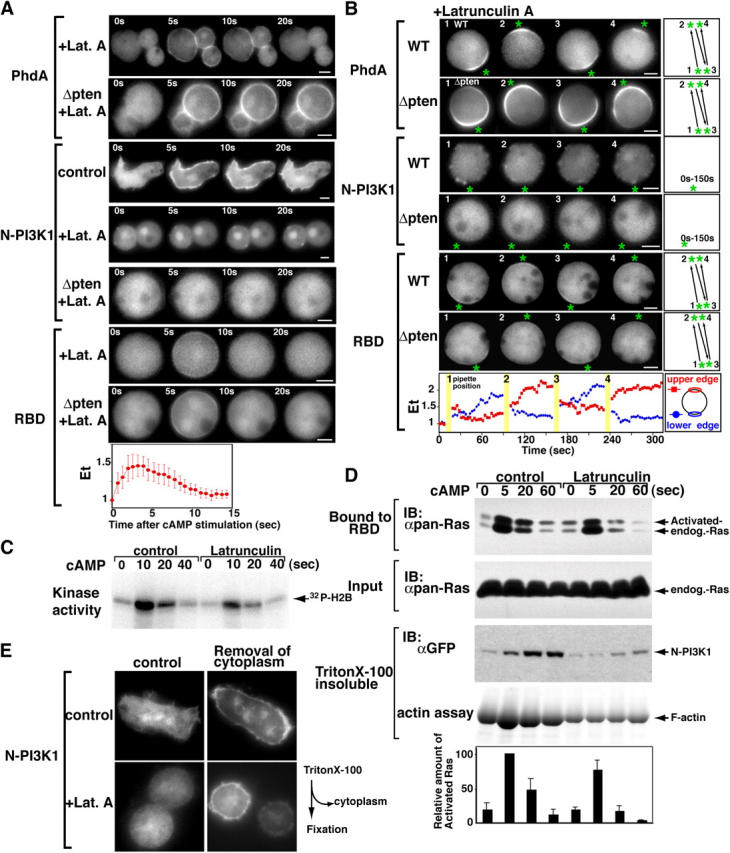
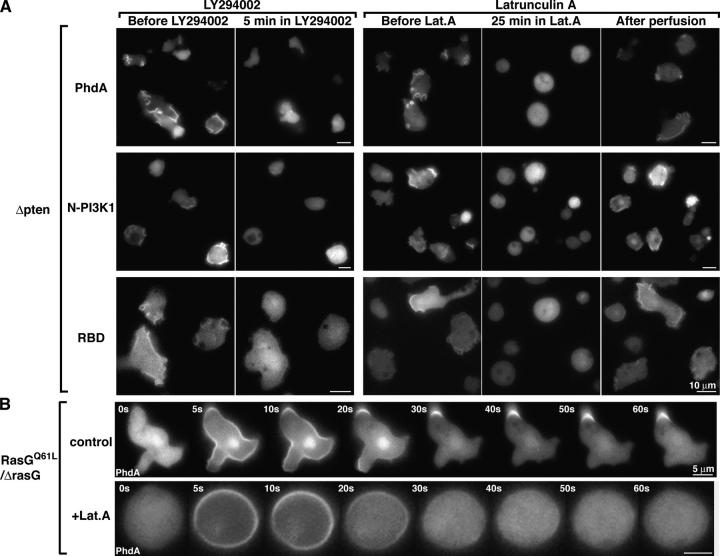
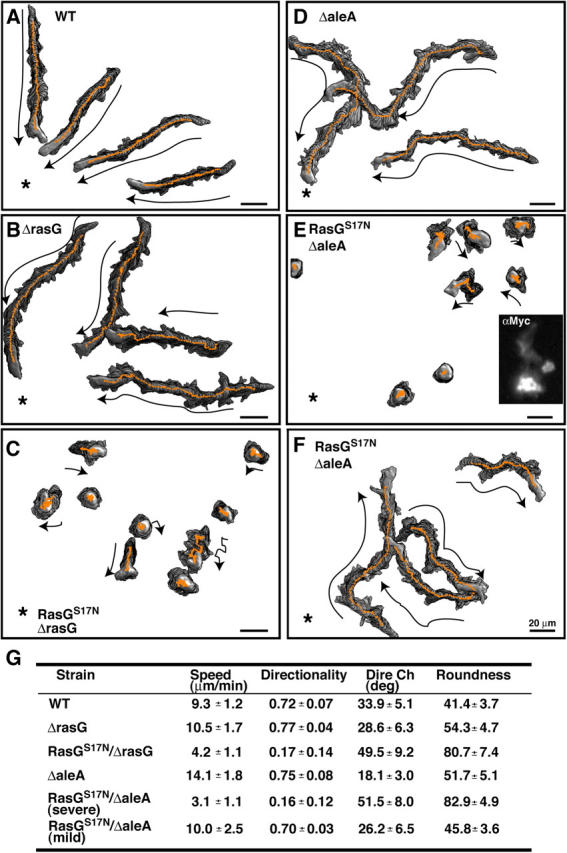
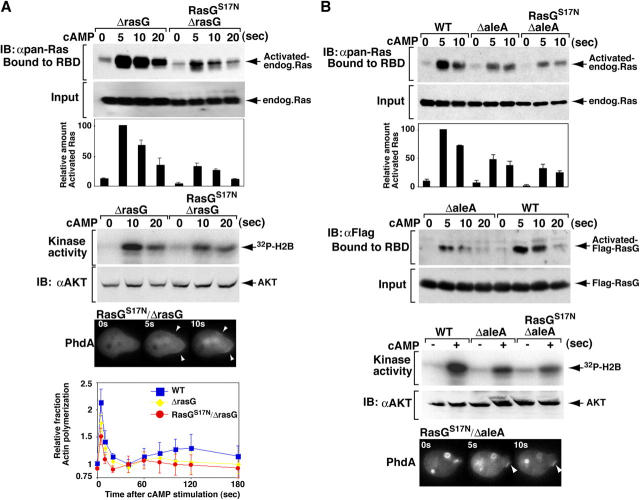
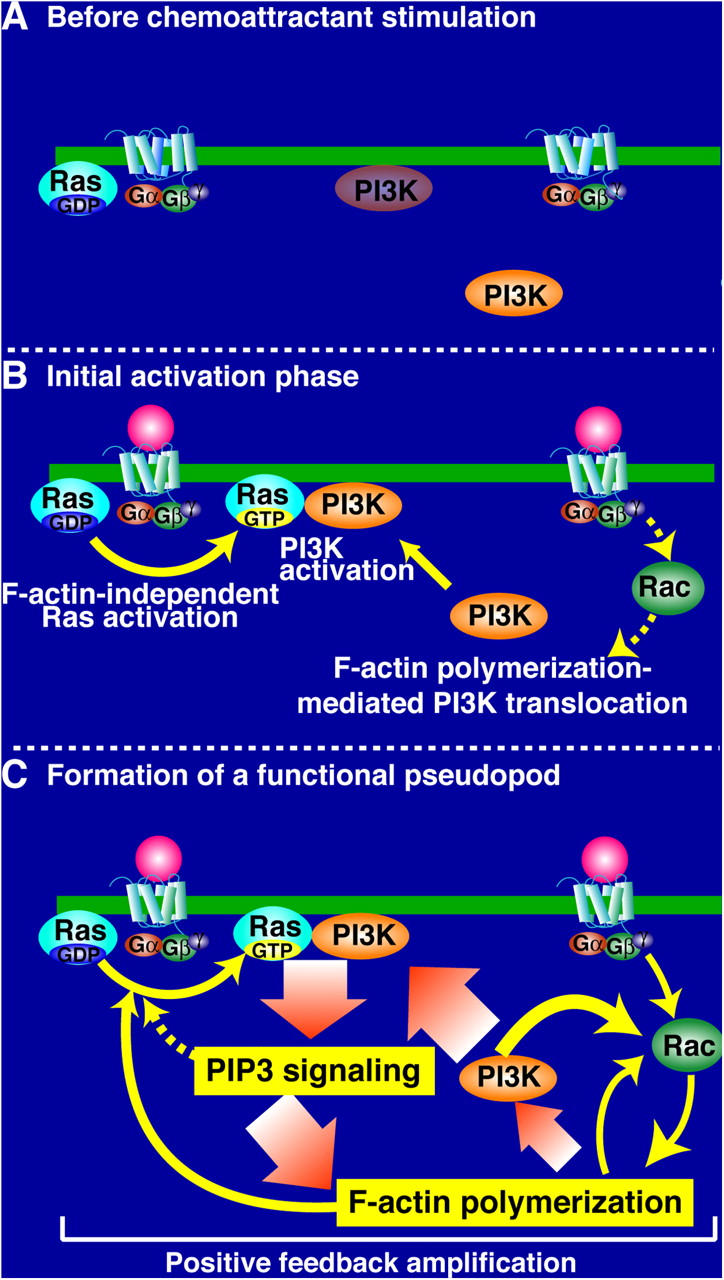
During chemotaxis, receptors and heterotrimeric G-protein subunits are distributed and activated almost uniformly along the cell membrane, whereas PI(3,4,5)P(3), the product of phosphatidylinositol 3-kinase (PI3K), accumulates locally at the leading edge. The key intermediate event that creates this strong PI(3,4,5)P(3) asymmetry remains unclear. Here, we show that Ras is rapidly and transiently activated in response to chemoattractant stimulation and regulates PI3K activity. Ras activation occurs at the leading edge of chemotaxing cells, and this local activation is independent of the F-actin cytoskeleton, whereas PI3K localization is dependent on F-actin polymerization. Inhibition of Ras results in severe defects in directional movement, indicating that Ras is an upstream component of the cell's compass. These results support a mechanism by which localized Ras activation mediates leading edge formation through activation of basal PI3K present on the plasma membrane and other Ras effectors required for chemotaxis. A feedback loop, mediated through localized F-actin polymerization, recruits cytosolic PI3K to the leading edge to amplify the signal.


Figures

Figure 1.
Figure 1.
Ras regulates PI3K signaling and distribution along the membrane. (A and B) Activation of Akt/PKB is shown. Aggregation-stage cells (see Materials and methods) were treated with 10 μM cAMP for the indicated time (A) or at 10 s (B) and then lysed, Akt was immunoprecipitated with anti-Akt antibody, and Akt activity was assayed (Meili et al., 1999). Akt protein levels were determined in each sample by Western blot analysis (bottom panels). (C) Fluorescent images of GFP-RasG/rasG null cells exposed to a chemoattractant gradient (left) or to uniform chemoattractant stimulation (right). An asterisk indicates the position of the micropipette. The numbers in the top left corners represent the time after initiation when the image was captured. The data are representative of eight separate experiments.
Figure 2.
Figure 2.
Activation of Dictyostelium Ras. The FLAG-RasG or endogenous Ras activation level in response to cAMP was assayed by a GST-RBD pull-down assay (see Materials and methods). Cells were stimulated with cAMP for the indicated duration, and the amount of Ras protein bound to GST-RBD was determined by Western blotting with the indicated antibody. The activated Ras was quantified by densitometry and normalized with total Ras. Cells were treated with 50 μM LY294002 or DMSO as a control for 20 min before the addition of cAMP (C). Similar results were observed over at least three independent experiments.
Figure 3.
Figure 3.
Spatial-temporal activation of Ras during chemotaxis. (A and B) The localization of GFP-RBD in wild-type vegetative cells (A) or aggregation-competent cells (B) was imaged. Translocation of GFP-RBD was imaged after stimulation with cAMP as described previously (Funamoto et al., 2001). (C) Translocation kinetics of GFP-tagged PhdA, CRAC-PH, N-PI3K1, and RBD in wild-type cells were obtained from time-lapse recordings. The graphs represent an average of data of movies taken from at least three separate experiments. The fluorescence intensity of membrane-localized GFP fusion protein was quantitated as Et as defined in Materials and methods. (D) Translocation of indicated GFP proteins in pi3k1/2 null cells or wild-type cells treated with 50 μM LY294002 for 20 min before cAMP stimulation. (E–I) Fluorescent images of GFP-RBD expressing wild-type cells (E and F), pi3k1/2 null cells (G), or pten null and myr-PI3K expressing cells (I) chemotaxing in a gradient of chemoattractant. An asterisk indicates the position of the micropipette. Fluorescent images of GFP-RBD and myr-PI3K1–expressing pi3k1/2 null cells (H, left) or GFP-RBD-expressing pten null cells (H, right) are shown. The sites producing multiple pseudopodia are marked with arrowheads.
Figure 4.
Figure 4.
Differential regulation between PI3K translocation and Ras activation. (A and B) Effect of LatA on the translocation of GFP-tagged PhdA-, N-PI3K1–, and RBD-expressing wild-type cells and pten null cells. Asterisk indicates the position of the micropipette (B). These images were captured ∼30 s after changing the micropipette position. The behaviors were consistently observed over five independent sessions. Translocation kinetics of RBD were obtained from a time-lapse recording of GFP-RBD–expressing wild-type cells. Fluorescence intensities of the upper and lower plasma membranes were quantitated as Et (see Materials and methods). (C) Effect of LatA on Akt/PKB activation. Akt/PKB assays were performed as described in Fig. 1. Data are representative of at least three independent experiments. (D) N-PI3K1 is recruited into the Triton X-100–resistant cytoskeleton in response to chemoattractant stimulation. Cytoskeletal fractions (see Materials and methods) were subjected to SDS-PAGE. Actin and N-PI3K1 recruitment were assessed with Coomassie stain or anti-GFP antibody, respectively. Ras activation was assayed using an aliquoted lysate. Graph shows an average of the results that were obtained from four independent experiments. (E) Fluorescent images of GFP-tagged N-PI3K1–expressing wild-type cells. Cells were treated with (right) or without (left) 0.01% Triton X-100 before fixation by 3.7% formaldehyde.
Figure 5.
Figure 5.
Feedback loop–mediated Ras/PI3K activation. (A) Fluorescent images of indicated GFP-protein expressing pten null cells before or 5 min after 50-μM LY294002 treatment or 25 min after 5 μM LatA treatment, and 20 min after the removal of LatA. (B) Fluorescent images of GFP-PhdA– and RasGQ61L-expressing rasG null cells.
Figure 6.
Figure 6.
Ras signaling regulates proper chemotaxis. (A–F) Time-lapse recording of chemotaxis of indicated strains pulsed with cAMP for 6 h. An asterisk indicates the position of a micropipette containing 150 μM cAMP. Tracing of the chemotaxis of individual cells is shown. The expression level of myc-tagged RasGS17N in aleA null cells was monitored by immunofluorescence (E, inset). (G) Analysis of chemotaxis using DIAS software (Soll and Voss, 1998). Speed refers to the speed of the cell's centroid movement along the total path. Directionality is a measure of how straight the cells move. Direction change (Dire Ch) is a measure of the number and frequency of turns the cell makes. Roundness is an indication of the polarity of the cells.
Figure 7.
Figure 7.
Activation of Akt/PKB and Ras. The effects of RasGS17N on Akt/PKB, Ras activation, and production of PI(3,4,5)P3 in rasG (A) and aleA (B) null cells were assayed as described in the legends to Figs. 1–4. The results were similar in five independent assays.
Figure 8.
Figure 8.
Model for the spatial and temporal regulation of Ras-induced chemotaxis. A model illustrating the intracellular signaling leading to local PI(3,4,5)P3 production is shown. (A) Resting cells with a basal level of PI3K at the plasma membrane. (B) The chemoattractant locally activates Ras at the presumptive leading edge (site closest to the chemoattractant source), where Ras then locally activates PI3K. There is a local polymerization of F-actin at the presumptive leading edge, which is partially Ras/PI3K independent, presumably controlled by Rho GTPase, WASP/SCAR, and Arp2/3. Our data suggest that the F-actin mediates PI3K translocation. (C) Locally produced PI(3,4,5)P3 induces further F-actin polymerization by activating downstream effectors, which would enhance the recruitment of PI3K to the membrane.

Similar articles

Cited by

References

    1. Chan, T.O., U. Rodeck, A.M. Chan, A.C. Kimmelman, S.E. Rittenhouse, G. Panayotou, and P.N. Tsichlis. 2002. Small GTPases and tyrosine kinases coregulate a molecular switch in the phosphoinositide 3-kinase regulatory subunit. Cancer Cell. 1:181–191. - PubMed
    1. Chen, L., C. Janetopoulos, Y.E. Huang, M. Iijima, J. Borleis, and P.N. Devreotes. 2003. Two phases of actin polymerization display different dependencies on PI(3,4,5)P3 accumulation and have unique roles during chemotaxis. Mol. Biol. Cell. 14:5028–5037. - PMC - PubMed
    1. Chiu, V., T. Bivona, A. Hach, J. Sajous, J. Silletti, H. Wiener, R.N. Johnson, A. Cox, and M. Philips. 2002. Ras signalling on the endoplasmic reticulum and the Golgi. Nat. Cell Biol. 4:343–350. - PubMed
    1. Chung, C.Y. and R.A. Firtel. 1999. PAKa, a putative PAK family member, is required for cytokinesis and the regulation of the cytoskeleton in Dictyostelium discoideum cells during chemotaxis. J. Cell Biol. 147:559–575. - PMC - PubMed
    1. Chung, C., S. Funamoto, and R. Firtel. 2001. a. Signaling pathways controlling cell polarity and chemotaxis. Trends Biochem. Sci. 26:557–566. - PubMed

Publication types