. 2004 Nov 8;167(3):519-30.
doi: 10.1083/jcb.200404173.

Live cell imaging of the assembly, disassembly, and actin cable-dependent movement of endosomes and actin patches in the budding yeast, Saccharomyces cerevisiae

Affiliations

Live cell imaging of the assembly, disassembly, and actin cable-dependent movement of endosomes and actin patches in the budding yeast, Saccharomyces cerevisiae

Thomas M Huckaba et al. J Cell Biol. .

Abstract

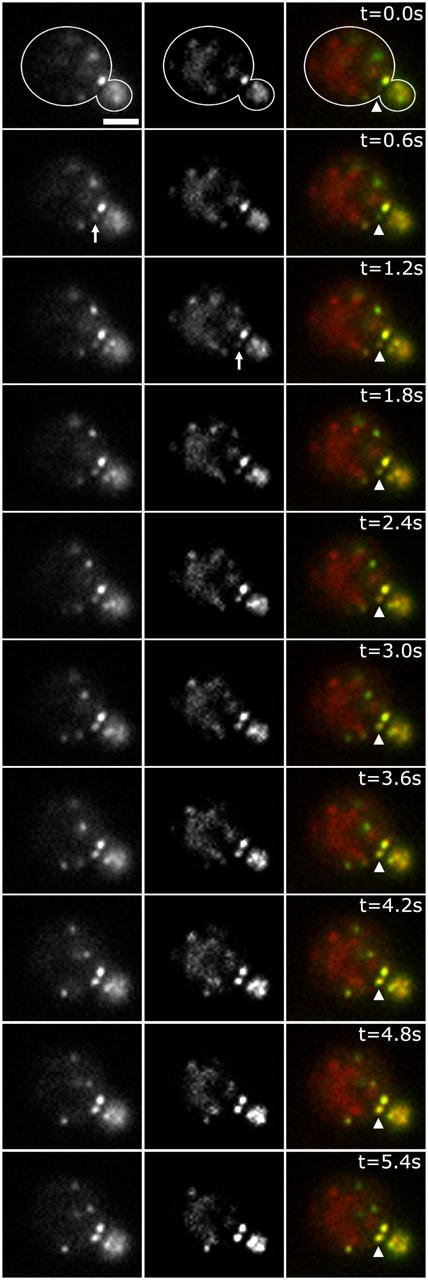
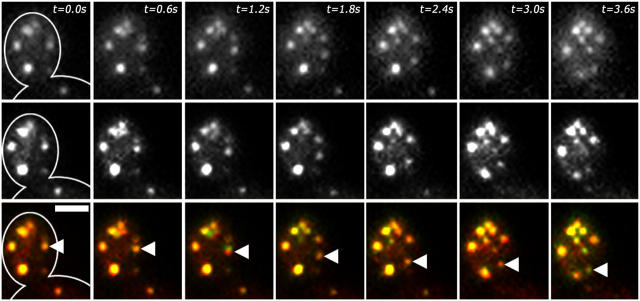
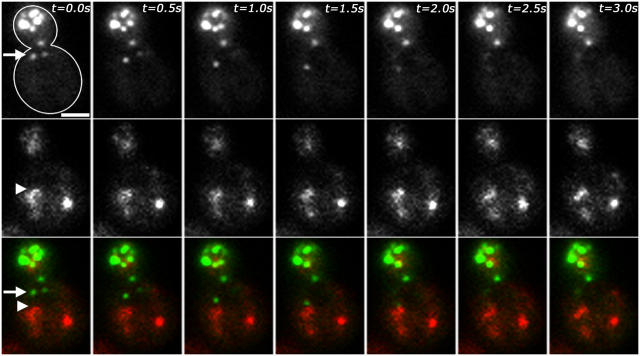
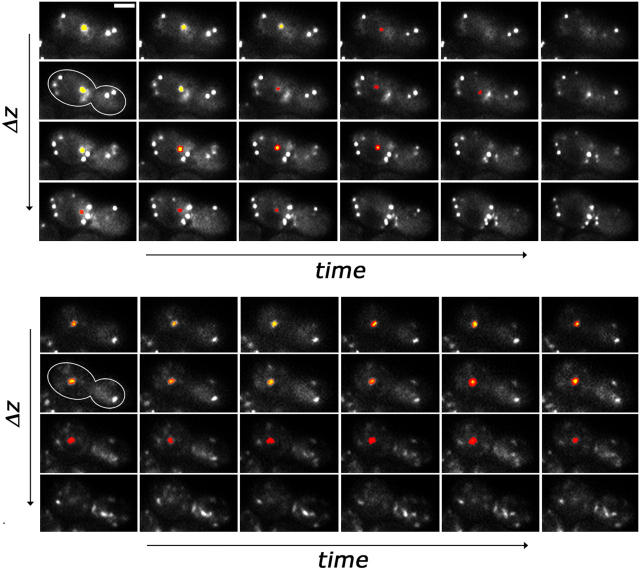
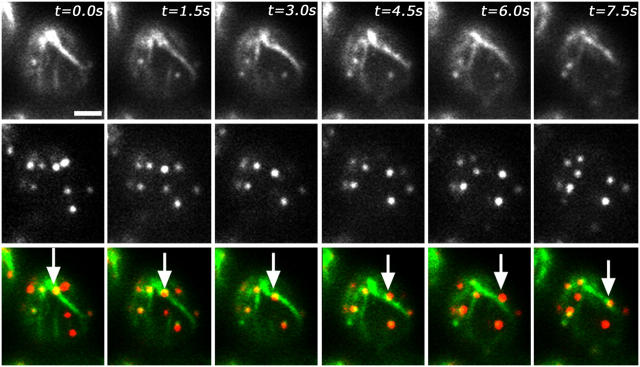
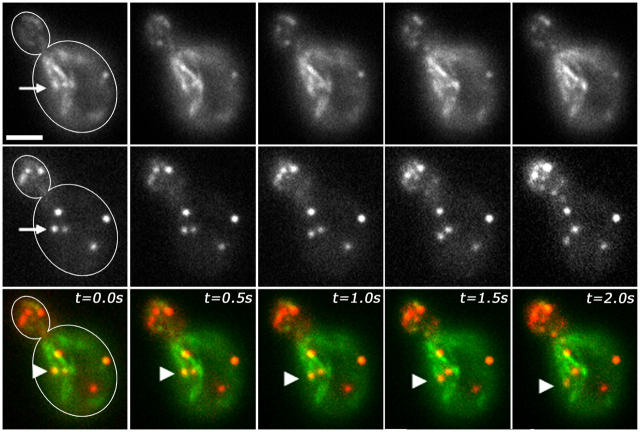
Using FM4-64 to label endosomes and Abp1p-GFP or Sac6p-GFP to label actin patches, we find that (1) endosomes colocalize with actin patches as they assemble at the bud cortex; (2) endosomes colocalize with actin patches as they undergo linear, retrograde movement from buds toward mother cells; and (3) actin patches interact with and disassemble at FM4-64-labeled internal compartments. We also show that retrograde flow of actin cables mediates retrograde actin patch movement. An Arp2/3 complex mutation decreases the frequency of cortical, nonlinear actin patch movements, but has no effect on the velocity of linear, retrograde actin patch movement. Rather, linear actin patch movement occurs at the same velocity and direction as the movement of actin cables. Moreover, actin patches require actin cables for retrograde movements and colocalize with actin cables as they undergo retrograde movement. Our studies support a mechanism whereby actin cables serve as "conveyor belts" for retrograde movement and delivery of actin patches/endosomes to FM4-64-labeled internal compartments.


Figures

Figure 1.
Figure 1.
FM4-64 and Abp1p-GFP assemble at the same punctate structures in living yeast. Mid-log phase wild-type haploid cells expressing Abp1p-GFP from the chromosomal locus were incubated with FM4-64 for 30 s at RT. Cells were washed with lactate medium to remove excess FM4-64 and analyzed by time-lapse fluorescence imaging within 2 min after initial incubation with FM4-64. Under these staining and imaging conditions, FM4-64 localizes to sites of endocytosis and endosomes. Cells were imaged in a single, cortical focal plane at RT using an optical beam splitter that allows for simultaneous imaging of Abp1p-GFP and FM4-64 (see Materials and methods). Images are still frames from a time-lapse series showing Abp1p-GFP in the left column, FM4-64 in the middle column, and a merged image showing Abp1p-GFP (green) and FM4-64 (red) in the right column. Outline of the cell is shown at t = 0 s. Arrowheads in merged images mark the site of FM4-64 and Abp1p-GFP accumulation. Arrows indicate the first time-points in which a signal is detectable for Abp1p-GFP (left) and FM4-64 (middle). Bar, 2 μm.
Figure 2.
Figure 2.
Visualization of the assembly of FM4-64 and Abp1p-GFP by 3D reconstruction combined with time-lapse imaging. Mid-log phase wild-type haploid cells expressing Abp1p-GFP from their chromosomal locus were incubated with FM4-64 as for Fig. 1. Cells were analyzed by simultaneous two-color imaging and 3D reconstruction combined with time-lapse imaging. Simultaneous two-color imaging was performed as for Fig. 1. Z-sections were obtained at 0.4-μm increments. The time interval between each successive set of z-sections is 1.6 s. The still frames shown are z-sections at focal planes that show sites of incorporation of Abp1p-GFP (top) and FM4-64 (bottom) at different time-points during the assembly process. The cell shown is unbudded and has polarized toward the presumptive bud site in the top of the cell. The structure of interest is pseudocolored according to the strength of the fluorescent signal, where yellow corresponds to greatest intensity, orange corresponds to medium intensity, and red corresponds to low intensity. Abp1p and FM4-64 accumulate in an intermediate focal plane in the second column and are not present either above or below the plane of appearance in the preceding column. Thus, the structures are indeed assembling, rather than moving into the focal plane. Bar, 2 μm.
Figure 3.
Figure 3.
Particles labeled with FM4-64 and Abp1p-GFP exhibit linear, retrograde movement. Mid-log phase wild-type haploid cells expressing Abp1p-GFP from the chromosomal locus were incubated with FM4-64 for 1 min at RT. Cells were washed with lactate medium to remove excess FM4-64, and imaged within 3 min after initial incubation with FM4-64. Two-color time-lapse imaging was performed as described for Fig. 1. Images shown are still frames from a time-lapse series showing Abp1p-GFP in the top row, FM4-64 in the middle row, and a merged image showing Abp1p-GFP in green and FM4-64 in red in the bottom row. The outline of the cell is shown in panels at t = 0 s. The bud, mother-bud neck, and part of the mother cell are shown. Arrowheads in the merged images mark an actin patch/endosome undergoing linear movement. Bar, 2 μm.
Figure 4.
Figure 4.
Abp1p-GFP disassembles after actin patches interact with FM4-64–labeled internal compartments. Mid-log phase wild-type haploid cells expressing Abp1p-GFP from the chromosomal locus were stained with FM4-64 for 2 min at RT. Cells were washed with lactate medium to remove excess FM4-64 and imaged 7 min after initial incubation of cells with FM4-64. Under these conditions, FM4-64 stains the endosomal sorting compartment (Holthuis et al., 1998). Two-color time-lapse imaging was performed as described for Fig. 1. Images shown are still frames from a time-lapse series showing Abp1p-GFP–labeled actin patches in the top row, FM4-64–labeled internal compartments in the middle row, and a merged image showing Abp1p-GFP in green and FM4-64 in red in the bottom row. The outline of the cell is shown in the top panel at t = 0 s. Arrows mark an Abp1p-GFP–labeled actin patch that undergoes retrograde movement and interacts with an FM4-64–labeled internal compartment, indicated by arrowheads. Bar, 2 μm.
Figure 5.
Figure 5.
Visualization of the disassembly of Abp1p-GFP at FM4-64–labeled internal compartments by 3D reconstruction combined with time-lapse imaging. Mid-log phase wild-type haploid cells expressing Abp1p-GFP were stained with FM4-64 as for Fig. 4. Cells were analyzed by simultaneous two-color imaging and 3D reconstruction combined with time-lapse imaging. Simultaneous two-color imaging was performed as for Fig. 1. Z-sections were obtained at 0.4-μm increments. The time interval between each successive set of z-sections is 1.6 s. The still frames shown are z-sections at focal planes that show sites of disassembly of Abp1p-GFP (top) as the particle interacts with an FM4-64–labeled internal compartment (bottom) at different time-points during the disassembly process. The cell shown is a large-budded cell. The structures of interest are in the mother cell and are pseudocolored as in Fig. 2. Optical sections taken above and below the plane of Abp1p-GFP–labeled particle disassembly indicate that the loss of Abp1p-GFP signal is due to disassembly, and not to movement of the particle out of the plane of imaging. Bar, 2 μm.
Figure 6.
Figure 6.
Abp1p-GFP and Sac6p-HcRed assemble at the same punctate structures in living yeast. Wild-type haploid cells expressing Abp1p-GFP and Sac6p-HcRed from the chromosomal loci were grown to mid-log phase in lactate medium and imaged in a single cortical focal plane using simultaneous two-color imaging as for Fig. 1. Images shown are still frames from a time-lapse series showing Abp1p-GFP–labeled actin patches in the top row, Sac6p-HcRed–labeled actin patches in the middle row, and a merged image showing Abp1p-GFP in green and Sac6p-HcRed in red in the bottom row. Arrowheads indicate the point of emergence of fluorescent signal in the top and middle rows. The outline of the cell is shown in the top panel at t = 0 s. Bar, 2 μm.
Figure 7.
Figure 7.
Assembly, movement, and disassembly of Sac6p-GFP. Mid-log phase wild-type haploid cells expressing Sac6p-GFP from the chromosomal locus. FM4-64 staining to detect endosomes in A was performed as described in Fig. 1. FM4-64 treatment to stain internal compartments in B was performed as described in Fig. 4. Two-color time-lapse imaging was performed as for Fig. 1. Images shown are still frames from time-lapse series showing Sac6p-GFP–labeled actin patches in green, FM4-64 in red, and sites of colocalization in yellow. The outline of each cell is shown in both panels at t = 0 s. In A, arrowheads indicate the coassembly of a Sac6p-containing actin patch and an FM4-64 labeled endosome. Arrow in A points to the beginning of a linear, retrograde movement of a Sac6p- and FM4-64-containing structure. In B, an arrow points to a Sac6p-labeled actin patch that undergoes linear, retrograde movement and subsequent disassembly at the FM4-64–labeled internal compartment. Bar, 2 μm.
Figure 8.
Figure 8.
Retrograde movement of actin patches occurs with the same velocity as retrograde actin cable movement and requires actin cables. (A) The velocity of actin cable and patch movement. Wild-type cells expressing either Abp140p-GFP or Abp1p-GFP from the chromosomal loci were grown to mid-log phase in lactate medium. Cells were imaged by time-lapse fluorescence imaging and the velocities of linear, retrograde movements of actin cables (n = 41) and actin patches (n = 42) was determined as described in Materials and methods. (B) Destabilization of actin cables results in loss of linear, retrograde actin patch movement. Abp1p was tagged at its chromosomal locus with HcRed in wild-type cells and yeast bearing a deletion of the BNR1 gene and a temperature-sensitive mutation in the BNI1 gene (bni1-11 bnr1Δ). Cells were grown to mid-log phase in lactate medium. At t = 0, aliquots of the liquid culture were removed and either maintained at permissive temperature (RT) or incubated at restrictive temperature (35°C) for 2 min. Time-lapse imaging of Abp1p-HcRed–labeled actin patches was performed at 23 and 35°C. The frequency of linear retrograde actin patch movement was defined by the number of linear retrograde actin patch movements per mother cell in the 20-s imaging period (n = 67–108 cells). Linear retrograde movement was defined as a movement away from the bud neck in the mother cell over three consecutive time-points.
Figure 9.
Figure 9.
Colocalization of actin patches and actin cables during retrograde movement. Wild-type haploid cells expressing Abp1p-HcRed and Abp140p-GFP from the chromosomal loci were grown to mid-log phase in lactate medium and were imaged in a single cortical focal plane using simultaneous two-color imaging as for Fig. 1. Images shown are still frames from a time-lapse series showing Abp140p-GFP–labeled actin cables in the top row, Abp1p-HcRed–labeled actin patches in the middle row, and a merged image showing Abp140p-GFP in green and Abp1p-HcRed in red in the bottom row. The cell shown is an unbudded cell in which the presumptive bud site is at the top of the cell. Arrows in the merged images mark an Abp1p-HcRed–labeled actin patch that undergoes linear, retrograde movement along an Abp140p-GFP–labeled actin cable. Bar, 2 μm.
Figure 10.
Figure 10.
An actin patch undergoing retrograde movement remains associated with an elongating actin cable at a fixed point. Mid-log phase yeast expressing Abp1p-HcRed and Abp140p-GFP were studied using simultaneous two-color imaging as for Fig. 4. Images shown are still frames from a time-lapse series showing Abp140p-GFP–labeled actin cables in the top row, Abp1p-HcRed–labeled actin patches in the middle row, and a merged image showing Abp140p-GFP in green and Abp1p-HcRed in red in the bottom row. Arrowheads in the merged images show the change in position of an actin patch that is associated with the tip of an elongating actin cable as both of these structures undergo linear, retrograde movement. Arrows mark the position of the tip of the actin cable at t = 0 (top row), and the position of the actin patch at t = 0 (middle row). Bar, 2 μm.

References

    1. Anderson, B.L., I. Boldogh, M. Evangelista, C. Boone, L.A. Greene, and L.A. Pon. 1998. The Src homology domain 3 (SH3) of a yeast type I myosin, Myo5p, binds to verprolin and is required for targeting to sites of actin polarization. J. Cell Biol. 141:1357–1370. - PMC - PubMed
    1. Artalejo, C.R., A. Elhamdani, and H.C. Palfrey. 2002. Sustained stimulation shifts the mechanism of endocytosis from dynamin-1-dependent rapid endocytosis to clathrin- and dynamin-2-mediated slow endocytosis in chromaffin cells. Proc. Natl. Acad. Sci. USA. 99:6358–6363. - PMC - PubMed
    1. Ayscough, K.R. 2000. Endocytosis and the development of cell polarity in yeast require a dynamic F-actin cytoskeleton. Curr. Biol. 10:1587–1590. - PubMed
    1. Boldogh, I.R., H.C. Yang, W.D. Nowakowski, S.L. Karmon, L.G. Hays, J.R. Yates III, and L.A. Pon. 2001. Arp2/3 complex and actin dynamics are required for actin-based mitochondrial motility in yeast. Proc. Natl. Acad. Sci. USA. 98:3162–3167. - PMC - PubMed
    1. Carlsson, A.E., A.D. Shah, D. Elking, T.S. Karpova, and J.A. Cooper. 2002. Quantitative analysis of actin patch movement in yeast. Biophys. J. 82:2333–2343. - PMC - PubMed

Publication types