. 2004 Nov 16;101(46):16351-6.
doi: 10.1073/pnas.0407586101. Epub 2004 Nov 8.

Associative learning shapes the neural code for stimulus magnitude in primary auditory cortex

Affiliations

Associative learning shapes the neural code for stimulus magnitude in primary auditory cortex

Daniel B Polley et al. Proc Natl Acad Sci U S A. .

Abstract

Since the dawn of experimental psychology, researchers have sought an understanding of the fundamental relationship between the amplitude of sensory stimuli and the magnitudes of their perceptual representations. Contemporary theories support the view that magnitude is encoded by a linear increase in firing rate established in the primary afferent pathways. In the present study, we have investigated sound intensity coding in the rat primary auditory cortex (AI) and describe its plasticity by following paired stimulus reinforcement and instrumental conditioning paradigms. In trained animals, population-response strengths in AI became more strongly nonlinear with increasing stimulus intensity. Individual AI responses became selective to more restricted ranges of sound intensities and, as a population, represented a broader range of preferred sound levels. These experiments demonstrate that the representation of stimulus magnitude can be powerfully reshaped by associative learning processes and suggest that the code for sound intensity within AI can be derived from intensity-tuned neurons that change, rather than simply increase, their firing rates in proportion to increases in sound intensity.


Figures
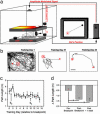
Fig. 1.
Fig. 1.
Design and performance measurements in an auditory learning task. (a) Rats in IC, USR, and PSR training groups were simultaneously exposed to the same amplitude-modulated stimulus. A computer continuously adjusted the sound intensity in real time as a function of the distance between the rat and the virtual bull's-eye, a randomly selected spatial location associated with either a 20- or 70-dB SPL stimulus. IC rats identified and navigated a sound intensity gradient to find the bull's-eye and obtain a food reward. Reinforcement in USR and PSR rats was independent of their behavior. In PSR rats, the reward was paired to reward delivery for the IC rat and, therefore, paired with a particular sound intensity, and, in USR rats, food was available ad libitum. The filled black circle, the X, and the red circle drawn in the computer monitor illustrate the current position of the IC rat, the position of the bull's-eye, and the diameter of the bull's-eye, respectively. The color gradient on the bull'seye platform represents the gradient of sound levels the rat experienced for a particular trial. (b) Black lines represent a rat's path in a single trial over three stages of training. The starting point for the trial is indicated by the star; the position and diameter of the bull's-eye are represented by an X and red circle, respectively. (Scale bar, 10 cm.) (c) Average path length per day shown relative to the behavioral breakpoint for all rats. Arrows indicate when the single path data from training days 21 (b2) and 32 (b3) shown in b occurred relative to the breakpoint. (d) Change in path length before, immediately after, and 1 wk after the behavioral breakpoint. Asterisks indicate P values <0.0005 from paired t tests.
Fig. 3.
Fig. 3.
Associative learning increases the proportion of nonmonotonic RLFs. (a-c) Example RLFs illustrate the minimum response threshold, transition point, and BL with an arrow, star, and diamond, respectively. (a) Note that in linearly increasing RLFs, the transition point cannot be defined. The red dotted line in each example depicts the slope of the linear regression line used to calculate monotonicity. (d) Decrease in path length (after breakpoint-before breakpoint) is significantly correlated with the average RLF slope. The relationship is fit with a linear regression. (e-g) Cumulative percentage functions depict the distribution of monotonicity values in USR (e), PSR (f), and IC (g) rats. The distribution of monotonicity values from NC rats is shown as a black line in each graph for comparison.
Fig. 2.
Fig. 2.
Associative learning changes the encoding of sound intensity in AI neurons. (a) Neurograms depict all RLFs recorded within AI from a single animal in each group. Each row represents a RLF from a single recording site, with the firing rate represented by a pseudocolor scale. Rows are sorted by BL such that BLs that correspond to lower sound intensities are presented at the bottom of each neurogram. Response at each intensity are normalized to the response evoked by the BL (100%/blue). (b-d) Cumulative percentage histograms compare the distributions of BL values for NC rats (black line for all graphs) with USR (b), PSR (c), and IC (d) rats. Significant differences in BL distributions obtained with a two-sample K-S test are indicated for each comparison.
Fig. 4.
Fig. 4.
Plasticity of the cortical population intensity code. (a-d) Data from NC, USR, PSR, and IC rats are shown in black, red, green, and blue, respectively. (a) Plot of the difference between neural response magnitude at each sound intensity in low-target-trained rats (20 dB) and responses to each sound intensity in high-target-trained rats (70 dB). Gray shading represents a hypothetical difference function in which responses were potentiated near the target intensity. The correlation between the actual response and the idealized response was calculated, and the Pearson correlation coefficient is shown. (b) Population growth of magnitude functions created by averaging all individual RLFs in NC, USR, PSR, and IC rats. (c) Absolute change in response strength between consecutive 8-dB intensity bins. Yellow shading indicates a 40-dB range over which the absolute change in response remained fairly constant for all groups. Asterisks indicate significant differences in absolute change by using pair-wise comparisons between trained (average of PSR and IC) and untrained (average of USR and NC) rats. (d) Percentage of recording sites in which response strength either increased (values above the dotted zero line) or decreased (values below the dotted zero line) by ≥10%. (e and h) Theoretical output from an array of monotonic (e) and nonmonotonic (f) neurons. (g and h) Population responses created from the sum of monotonic or nonmonotonic response functions (g) can be used to predict the probability of detecting changes in sound intensity (h).

References

    1. Stevens, S. S. (1975) Psychophysics: Introduction to Its Perceptual, Neural, and Social Prospects (Wiley, New York).
    1. Werner, G. & Mountcastle, V. B. (1965) J. Neurophysiol. 28, 359-397. - PubMed
    1. Mountcastle, V. B., Poggio, G. F. & Werner, G. (1963) J. Neurophysiol. 26, 807-834. - PubMed
    1. Johnson, K. O., Hsiao, S. S. & Blake, D. T. (1996) in Somesthesis and the Neurobiology of the Somatosensory Cortex, eds. Franzen, O., Johansson, R. & Terenius, L. (Birkhäuser, Basel), pp. 213-228.
    1. Moore, B. J. (1995) Hearing (Academic, New York).

Publication types