. 2004 Dec;2(12):e398.
doi: 10.1371/journal.pbio.0020398. Epub 2004 Nov 9.

Conservation and evolution of cis-regulatory systems in ascomycete fungi

Affiliations

Conservation and evolution of cis-regulatory systems in ascomycete fungi

Audrey P Gasch et al. PLoS Biol. 2004 Dec.

Abstract

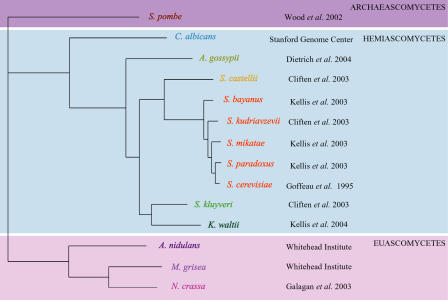
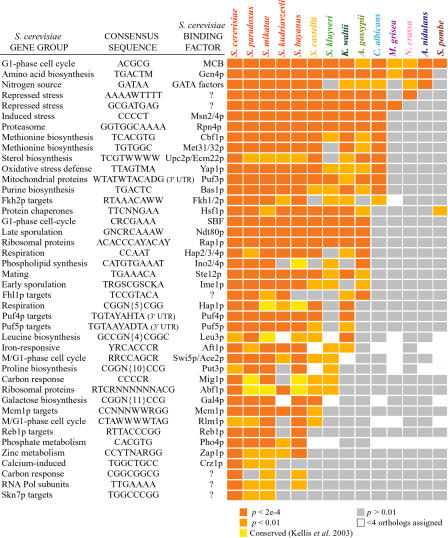
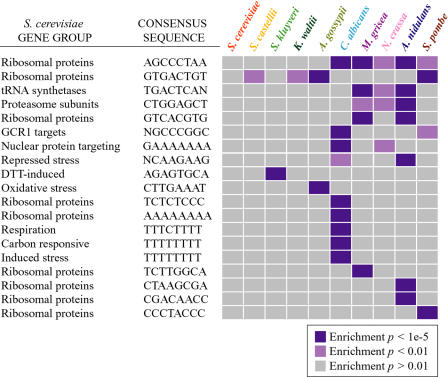
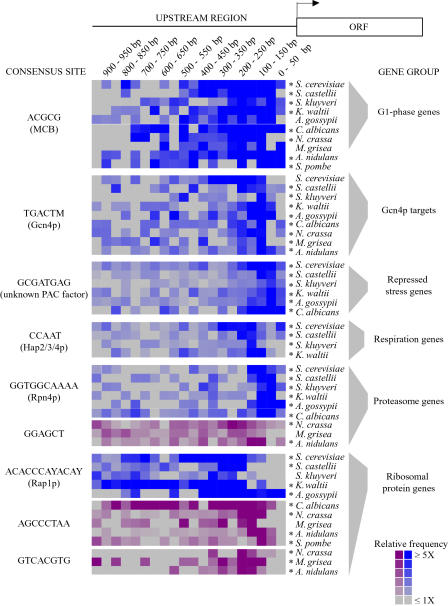
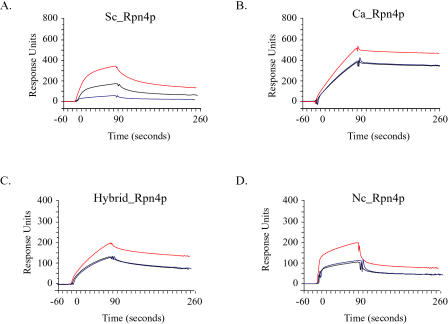
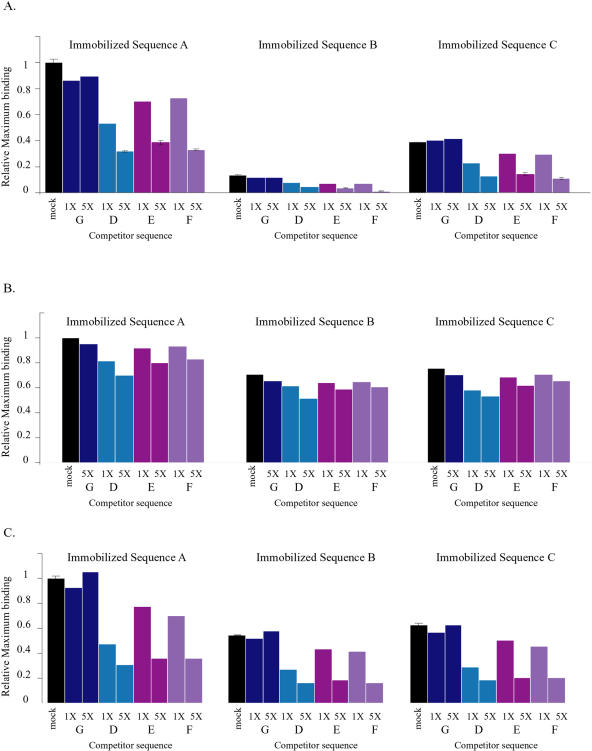
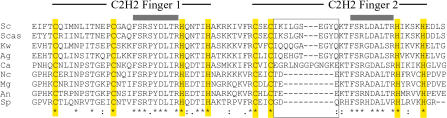
Relatively little is known about the mechanisms through which gene expression regulation evolves. To investigate this, we systematically explored the conservation of regulatory networks in fungi by examining the cis-regulatory elements that govern the expression of coregulated genes. We first identified groups of coregulated Saccharomyces cerevisiae genes enriched for genes with known upstream or downstream cis-regulatory sequences. Reasoning that many of these gene groups are coregulated in related species as well, we performed similar analyses on orthologs of coregulated S. cerevisiae genes in 13 other ascomycete species. We find that many species-specific gene groups are enriched for the same flanking regulatory sequences as those found in the orthologous gene groups fromS. cerevisiae, indicating that those regulatory systems have been conserved in multiple ascomycete species. In addition to these clear cases of regulatory conservation, we find examples of cis-element evolution that suggest multiple modes of regulatory diversification, including alterations in transcription factor-binding specificity, incorporation of new gene targets into an existing regulatory system, and cooption of regulatory systems to control a different set of genes. We investigated one example in greater detail by measuring the in vitro activity of the S. cerevisiae transcription factor Rpn4p and its orthologs from Candida albicans and Neurospora crassa. Our results suggest that the DNA binding specificity of these proteins has coevolved with the sequences found upstream of the Rpn4p target genes and suggest that Rpn4p has a different function in N. crassa.


Conflict of interest statement

The authors have declared that no conflicts of interest exist.

Figures

Figure 1
Figure 1. Fungal Phylogeny
The phylogenetic tree shows the 14 different fungi analyzed in this study. The topology of the tree was based on Kurtzman and Robnett (2003), and the branch lengths represent the average of maximum-likelihood estimates of synonymous amino acid substitutions (obtained using the PAML package [Yang 1997]) for the 303 proteins that had orthologs assigned in all 14 of these genomes. The closely related saccharomycete species for which the orthologous upstream regions can be aligned are labeled in orange. The source of each genome sequence is also indicated to the right of each species.
Figure 2
Figure 2. Conservation ofCis-Sequence Enrichment in Specific Gene Groups
Gene groups from each of the 14 species that are enriched for genes whose flanking regions contain known or novelcis-sequences are represented by orange boxes. Each row represents a group of coexpressed S. cerevisiae genes and a singlecis-regulatory element known or predicted to control the genes' expression, as indicated to the left of the figure. Each column in the figure represents the orthologous gene groups in 14 different fungal species. An orange box indicates that the S. cerevisiae cis-regulatory sequence listed to the left of the diagram is enriched in the denoted S. cerevisiae genes or their orthologs in each fungal genome, according to the key at the bottom of the figure. The p-values for each group are available in Datasets S14–S46, and the number of orthologs in each gene group is available in Dataset S49. Somecis-regulatory elements did not meet our significance cutoff for enrichment but had been previously identified as conserved in related gene groups from the closely related saccharomycete species (Kellis et al. 2003), and these are denoted with a yellow box. A gray box indicates that the denoted sequence was not significantly enriched in that gene group, while a white box indicates that fewer than four orthologs were identified in the species. The rows are organized in decreasing order of the number of species in which the element was enriched.
Figure 3
Figure 3. Enrichment of Novel Sequences in Coregulated Genes from Other Species
Gene groups from each of the 14 species that are enriched for genes containing novel upstream sequences identified by MEME (see Materials and Methods for details) are shown, as described in Figure 2. Enrichment of genes that contain thecis-sequence listed to the left of the diagram is indicated by a purple box, according to the key at the bottom of the figure.
Figure 4
Figure 4. Distribution of Cis-Regulatory Elements Upstream of Coregulated Genes
The distribution of nine different sequences motifs (represented to the left of the figure by the consensus sequences and their known binding proteins) was measured in 50-bp windows within 1,000 bp upstream of the putative target genes (denoted to the right of the figure). Each colored box represents the frequency of an element in a 50-bp window upstream of the target genes compared to the element's frequency in the corresponding window of all upstream regions in each genome. Blue boxes represent sequences that matched the S. cerevisiae MEME matrices, while purple boxes represent sequences that matched the designated species-specific MEME matrices. Distributions that were significantly different from background in at least one 50-bp window (p < 0.01) were identified using the hypergeometric distribution (as described in Materials and Methods) and are denoted by an asterisk.
Figure 5
Figure 5. Spatial Relationships betweenCis-Regulatory Elements
The mean spacing between the Cbf1p- and Met31/32p- binding sites within 500 bp upstream of the methionine biosynthesis genes (m) and of all of the genes in each genome (g) was calculated for the species indicated. The error bars represent twice the standard error, indicating the range of the estimated means with 95% confidence. The values below each plot indicate the number of binding-site pairs used in each calculation.
Figure 6
Figure 6. Position-Weight Matrices Representing Proteasome Cis-Regulatory Elements
Sequences within 500 bp upstream of the S. cerevisiae or C. albicans proteasome genes that matched the species-independent meta-matrix were identified as described. The identified sequences were used to generate sequence logos (Crooks et al. 2004) to represent the set of cis-sequences from S. cerevisiae (left) or from C. albicans (right). The height of each letter represents the frequency of that base in that position of the matrix. Positions in the matrices that are statistically different (see Materials and Methods for details) are indicated with an asterisk.
Figure 7
Figure 7. In Vitro DNA-Binding Profiles of Rpn4p Proteins
Profiles of 50 nM Sc_Rpn4p (A), Ca_Rpn4p (B), Hybrid_Rpn4p (C), and Nc_Rpn4p (D) binding to Sequence A (S. cerevisiae-specific; red curve), Sequence B (C. albicans-specific; blue curve), and Sequence C (hybrid; black curve) are shown. Protein was injected into the Biacore system at time = 0 for a duration of 90 sec, after which time buffer was injected and the protein dissociated from the Biacore chip. The scale of each binding profile was adjusted such that the binding levels to Sequence A are comparable for all species.
Figure 8
Figure 8. In Vitro Competition for DNA Binding
The maximum response units of binding were measured for Sc_Rpn4p (A), Ca_Rpn4p (B), or the hybrid protein (C) binding to Sequence A (left graphs), Sequence B (center graphs), and Sequence C (right graphs) in the absence (“mock”) or presence of a 1× or 5× molar excess of competitor fragments: Sequence G (with a core sequence of CTGCATTTGG), Sequence D (GGTGGCAAAA), Sequence E (AGTGGCAAAA), and Sequence F (GGTGGCAACA). Each histogram shows the maximum response units of binding, relative to the maximum response units measured for that protein binding to the Sequence A in the absence of competitor. Replicate experiments were performed for each mock reaction and the 5:1 competition experiments for Sc_Rpn4p protein. The range of replicate measurements was very narrow and is indicated by the error bars.
Figure 9
Figure 9. Sequence Alignment of the DNA-Binding Domain of Rpn4p and Its Orthologs
Clustal W was used to identify a multiple alignment between S. cerevisiae Rpn4p and its orthologs in the other fungi; the alignment over the DNA binding domain is shown. No ortholog was identified by our method in S. kluyveri, apparently due to poor sequence coverage in that region (unpublished data). The conserved cysteine and histidine residues of the two C2H2 zinc-finger domains are highlighted in yellow, and the domain in each finger that is predicted to contact the DNA is indicated with a gray bar. The region of sequence variation between the hemiascomycete and euascomycete Rpn4p proteins is indicated with a box.

References

    1. Ainsworth GC, Kirk PM, Bisby GR. Dictionary of the fungi. Kirk PM, Cannon PF, David JC, editors. Egham, UK: CABI Publishing; 2001. 616 p pp.
    1. Averof M, Patel NH. Crustacean appendage evolution associated with changes in Hox gene expression. Nature. 1997;388:682–686. - PubMed
    1. Bailey TL, Elkan C. Fitting a mixture model by expectation maximization to discover motifs in biopolymers. Proc Int Conf Intell Syst Mol Biol. 1994;2:28–36. - PubMed
    1. Benos PV, Lapedes AS, Stormo GD. Probabilistic code for DNA recognition by proteins of the EGR family. J Mol Biol. 2002;323:701–727. - PubMed
    1. Berbee ML, Taylor JW. Dating the evolutionary radiations of the true fungi. Can J Bot. 1993;71:1114–1127.

Publication types

MeSH terms