. 2004;5(11):R87.
doi: 10.1186/gb-2004-5-11-r87. Epub 2004 Nov 1.

Genomic transcriptional response to loss of chromosomal supercoiling in Escherichia coli

Affiliations

Genomic transcriptional response to loss of chromosomal supercoiling in Escherichia coli

Brian J Peter et al. Genome Biol. 2004.

Abstract

Background: The chromosome of Escherichia coli is maintained in a negatively supercoiled state, and supercoiling levels are affected by growth phase and a variety of environmental stimuli. In turn, supercoiling influences local DNA structure and can affect gene expression. We used microarrays representing nearly the entire genome of Escherichia coli MG1655 to examine the dynamics of chromosome structure.

Results: We measured the transcriptional response to a loss of supercoiling caused either by genetic impairment of a topoisomerase or addition of specific topoisomerase inhibitors during log-phase growth and identified genes whose changes are statistically significant. Transcription of 7% of the genome (306 genes) was rapidly and reproducibly affected by changes in the level of supercoiling; the expression of 106 genes increased upon chromosome relaxation and the expression of 200 decreased. These changes are most likely to be direct effects, as the kinetics of their induction or repression closely follow the kinetics of DNA relaxation in the cells. Unexpectedly, the genes induced by relaxation have a significantly enriched AT content in both upstream and coding regions.

Conclusions: The 306 supercoiling-sensitive genes are functionally diverse and widely dispersed throughout the chromosome. We propose that supercoiling acts as a second messenger that transmits information about the environment to many regulatory networks in the cell.


Figures
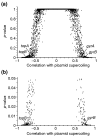
Figure 1
Figure 1
Significance versus correlation of gene expression and plasmid supercoiling values for all genes over all experiments. For each gene we computed the correlation coefficient between its gene expression ratios (base 2 logarithm) over all experiments with the superhelical density (σ) of a reporter plasmid, as measured by gel electrophoresis. These values are plotted against the p-value, which represents the chance that the difference in expression between relaxation and control experiments could have arisen randomly. (a) Scatter plot for all genes. There is a general trend in which genes with low p-values showed very high correlation (absolute value) between expression and plasmid supercoiling. The points corresponding to the topoisomerase genes gyrA, gyrB, topA and topB are indicated. (b) Expanded portion of (a) highlighting those genes classified as significant (p < 0.05). Genes with very low p-values show high positive or negative correlation between expression and plasmid supercoiling.
Figure 2
Figure 2
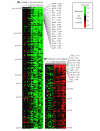
Expression profiles of relaxation-induced and repressed genes. The figure shows a cluster diagram ordered according to the p-value of each gene (from 0.000125 to 0.05). Each row represents a gene and each column an experiment. Therefore, each of the entries of the array shows the expression level for a gene in a given experiment. (a) Relaxation-repressed genes; (b) relaxation-induced genes. The set of experiments labeled 1 to 14, to the left of the vertical mark in (a and b), represents the control set in which plasmid supercoiling did not change. Experiments to the right of the vertical mark, labeled from 15 to 35, are experiments in which the chromosome is relaxed. As experiments were done in a time-dependent fashion, red color means that gene expression is higher at time points after relaxation of the chromosomes, while green means the opposite. Black indicates no change in expression during the experiment. Columns 1-5, gene expression measured after addition of 15 μg/ml norfloxacin to a norfloxacin-resistant strain at times t = 2, 5, 10, 20 or 30 min; columns 19-27, gene expression measured after addition of 15 μg/ml norfloxacin to an isogenic wild-type strain at times t = 2, 3, 4, 5, 7, 10, 15, 20 or 30 min; columns 6-10, gene expression at times t = 2, 5, 10, 20 or 30 min after addition of 50 μg/ml norfloxacin to a norfloxacin-resistant strain; columns 28-32, gene expression at these times after addition of the same concentration of norfloxacin to an isogenic wild-type strain; columns 15-18, gene expression at times t = 2, 5, 10 or 20 min after temperature shift in a temperature-sensitive mutant strain; columns 11-14, gene expression at times t = 2, 5, 10 or 20 min after temperature shift in an isogenic wild-type strain; columns 33-35, gene expression at fixed time t = 5 min and varying concentrations of novobiocin (Novo) = 20, 50 or 200 μg/ml on a wild-type strain. A total of 200 genes are repressed in response to DNA relaxation, while 106 genes are induced. The top row is a model expression profile of the supercoiling of the reporter plasmid in each experiment (Table 1). p-values and correlation coefficients with plasmid supercoiling levels for the top 10% of genes in each class are listed. The complete expression data for each gene can be found in Additional data file 2.
Figure 3
Figure 3
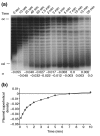
Plasmid relaxation kinetics. gyrA+parC+ cells were treated with 15 μg/ml norfloxacin for the indicated times before samples were removed for DNA and microarray analysis. (a) pBR322 plasmid DNA was isolated and run on a 1% agarose gel + 2.8 μg/ml chloroquine to provide an indicator of topoisomerase activity in the cells. The positions of open circular (oc) and relaxed (rel) marker plasmids on the gel are shown. The distribution of native (-) supercoiled DNA is shown in lane 1. As the plasmid becomes relaxed, the center of the distribution first moves toward the open circular form and then moves down the gel to the relaxed position. The calculated superhelical density values for the plasmids (σ) are shown at bottom of each lane. (b) Graph of the average σ values from (a). Values of σ stabilized around 0 for times greater than 10 min and are not shown.
Figure 4
Figure 4
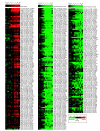
Kinetics of the expression changes of the supercoiling-sensitive genes. Norfloxacin was added to wild-type E. coli cells and RNA was extracted from cells removed from the culture at the time points shown (in minutes) above each column. This diagram illustrates the kinetics of the SSG responses, which are ranked by their correlation to plasmid supercoiling levels in this experiment (see Figure 3). p-values and correlation coefficients for each gene are listed (see Materials and methods for calculation). The model profiles shown at the top are colored representations of plasmid supercoiling levels, as in Figure 2. Red squares indicate that a gene is induced during the experiment, green squares that a gene is repressed.
Figure 5
Figure 5
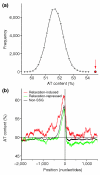
Analysis of AT content in upstream regions of SSGs. (a) The average upstream AT content of 50,000 groups of 106 randomly selected genes. The actual average upstream AT content of the group of 106 relaxation-induced genes (red circle) lies well outside the distribution. (b) Average AT content in a 100-nucleotide window is plotted against distance from the start codon for relaxation-induced (red), relaxation-repressed (green) and all other (black) genes for 300 nucleotides to either side of the translation start site. The y-axis is drawn at the first nucleotide of the start codon, and a horizontal line indicates 50% AT content. The relaxation-induced genes show a significantly increased AT content relative to the other sets of genes both before and after the start codon. The relaxation-repressed genes show a milder depression of AT content over this region, which is still significantly different from the rest of the genome. We found no significant differences outside the region shown.
Figure 6
Figure 6
Chromosomal map of SSGs. Supercoiling-sensitive genes were mapped across the E. coli genome. Relaxation-induced genes are colored red and relaxation-repressed genes are in green. Genes are dispersed through the entire chromosome, making them good sensors for local changes of supercoiling of the chromosome.

Similar articles

Cited by

References

    1. Funnell BE, Baker TA, Kornberg A. In vitro assembly of a prepriming complex at the origin of the Escherichia coli chromosome. J Biol Chem. 1987;262:10327–10334. - PubMed
    1. Lia G, Bensimon D, Croquette V, Allemand JF, Dunlap D, Lewis DE, Adhya S, Finzi L. Supercoiling and denaturation in Gal repressor/heat unstable nucleoid protein (HU)-mediated DNA looping. Proc Natl Acad Sci USA. 2003;100:11373–11377. - PMC - PubMed
    1. Wang JC, Lynch AS. Effects of DNA supercoiling on gene expression. In: Lin ECC, Lynch AS Austin, editor. Regulation of Gene Expression in Escherichia coli. TX: R.G. Landes Company; 1996. pp. 127–147.
    1. Rui S, Tse-Dinh YC. Topoisomerase function during bacterial responses to environmental challenge. Front Biosci. 2003;8:d256–d263. - PubMed
    1. Pruss GJ, Manes SH, Drlica K. Escherichia coli DNA topoisomerase I mutants: increased supercoiling is corrected by mutations near gyrase genes. Cell. 1982;31:35–42. - PubMed

Publication types

MeSH terms