

doi: 10.1186/gb-2004-5-11-r94.
Epub 2004 Nov 1.
Consensus clustering and functional interpretation of gene-expression data
Affiliations
- PMID: 15535870
- PMCID: PMC545785
- DOI: 10.1186/gb-2004-5-11-r94
Item in Clipboard
Consensus clustering and functional interpretation of gene-expression data
Genome Biol.
2004.
Abstract
Microarray analysis using clustering algorithms can suffer from lack of inter-method consistency in assigning related gene-expression profiles to clusters. Obtaining a consensus set of clusters from a number of clustering methods should improve confidence in gene-expression analysis. Here we introduce consensus clustering, which provides such an advantage. When coupled with a statistically based gene functional analysis, our method allowed the identification of novel genes regulated by NFkappaB and the unfolded protein response in certain B-cell lymphomas.
Figures

Pairwise comparison of consistency between different cluster algorithm data partitions using the weighted-kappa metric (Table 1) to score similarity. Each clustering algorithm was used to analyze the Amersham Score Card dataset (black bars) and the B-cell lymphoma dataset (gray bars), and the cluster-method agreement based on assigning the same genes to the same cluster was calculated and scored. HC, hierarchical clustering; CAST, cluster affinity search technique; PAM, partitioning around medoids; and SA, simulated annealing.

A visual representation of the agreement matrix used as input to robust and consensus clustering. The n × n matrix is upper triangular. Each cell within the matrix, referenced by column i and row j, represents the number of clustering methods that have placed gene i and gene j into the same cluster. In other words, the number represents the agreement between clustering methods concerning gene i and gene j.

Comparison between consensus clustering and pairwise clustering. The weighted-kappa score for consensus clustering (solid line) calculated by comparing consensus clusters to the corresponding individual clustering algorithm is shown relative to mean pairwise weighted-kappa score for each single method compared to all other single methods (broken line) for (a) the ASC dataset, (b) the B-cell lymphoma dataset. The maximum and minimum weighted-kappa scores for the collection of single methods are indicated by the error bars. The definitions of weighted-kappa scores are derived from Table 1. The parameter settings for the clustering algorithms are: HC and PAM, 13 clusters for the ASC dataset and 40 for the B-cell dataset; CAST, affinity level 0.5; and SA, θ0 = 100, c = 0.99994 and number of iterations = 1,000,000.

Probability scores and cluster size. (a) The lowest probability scores determined for clusters containing the following functional group signature genes were identified: AC, actin cytoskeleton; BST, B-cell signal transduction; EGT, ER/Golgi trafficking; ERUPR, ER stress/unfolded protein response; ICS, immunoglobulin class switching; IA, inflammation and adhesion; NFκB, NFκB signaling; OBS, other B-cell signaling; P, proliferation; RNA, RNA maturation and splicing. The mean (open diamond), standard error (green line) and standard deviation (thin black line and bars) of the minimum probability scores for SA, CAST, HC and PAM are shown together with the minimum probability score for the corresponding consensus cluster (red circle). (b) The cluster size (si) (open circles) and number of defining functional group genes (FG) (open squares) for the NFκB signaling and ER/UPR functional groups are shown together with the FG/si ratio (open diamonds).

Visualization of average linkage HC using the programs Cluster and Treeview [5] of the NFκB responsive gene cluster identified from consensus clustering and functional annotation. The sample names correspond to different leukemia and lymphoma samples [21], with the NFκB-responsive gene cluster being predominantly expressed in the cell lines Raji, PEL-B, EHEB, BONNA-12 and L-428. Gene names with red circles represent those genes that contain one or more NFκB-binding sites in the region up to 1,000 bp upstream from the putative transcriptional start site.
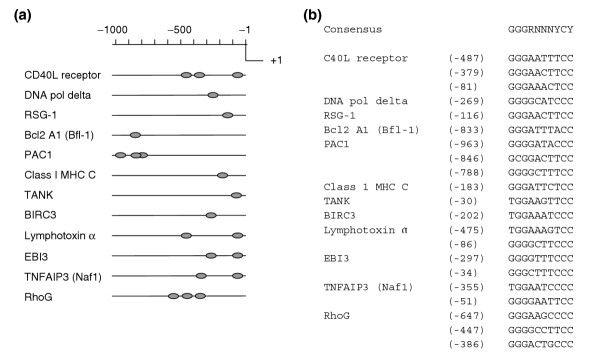
Location and consensus sequence of NFκB-binding sites. (a) Position of the NFκB-binding sites identified in the upstream 1,000-bp regions of each gene. The gray ovals represent the position of each binding site shown in (b) where the nucleotide sequence for each respective NFκB-binding site is shown relative to the consensus NFκB-binding site GGGRNNNYCY (R is G or A (purine), Y is T or C (pyrimidine) and N is any nucleotide).

Genes involved in the ER/UPR. (a) Visualization of the ER/UPR consensus cluster using Cluster and Treeview. The ATF6 gene is indicated by a green circle. Gene names indicated by red circles represent those genes whose upstream 1,000-bp regions contain (b) the endoplasmic reticulum stress response element (ESRE), namely, calnexin and TRA1, or unfolded protein response element (UPRE) namely, DPAGT1 and MGAT2.
References
-
- Ward JH. Hierarchical grouping to optimize an objective function. J Am Stat Assoc. 1963;58:236–244.
-
- McQueen J. 5th Berkeley Symposium on Mathematical Statistics and Probability. Berkeley; 1967. Some methods for classification and analysis of multivariate observations. pp. 281–297.
-
- Kaufman L, Rousseeuw PJ. Clustering by means of medoids. In: Dodge Y, editor. Statistical Analysis Based Upon the L1 Norm. Amsterdam: North-Holland; 1987. pp. 405–416.
-
- Goldstein D, Ghosh D, Conlon E. Statistical issues in the clustering of gene expression data. Stat Sin. 2002;12:219–241.
