Comparative Study
. 2004 Nov-Dec;11(6):770-86.
doi: 10.1101/lm.86104. Epub 2004 Nov 10.

Nonassociative learning processes determine expression and extinction of conditioned fear in mice

Affiliations
Comparative Study

Nonassociative learning processes determine expression and extinction of conditioned fear in mice

Kornelia Kamprath et al. Learn Mem. 2004 Nov-Dec.

Abstract

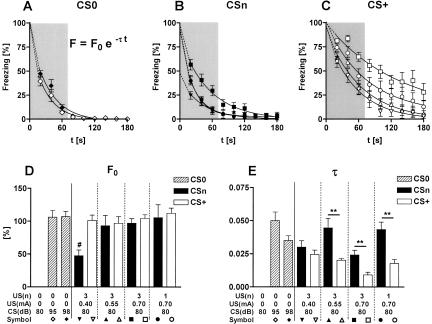
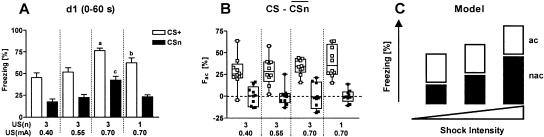
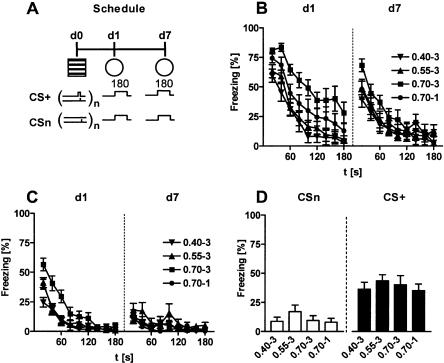
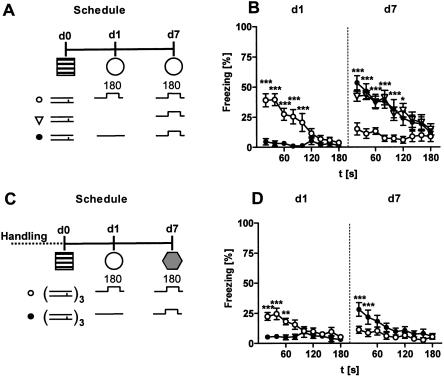
Freezing to a tone following auditory fear conditioning is commonly considered as a measure of the strength of the tone-shock association. The decrease in freezing on repeated nonreinforced tone presentation following conditioning, in turn, is attributed to the formation of an inhibitory association between tone and shock that leads to a suppression of the expression of fear. This study challenges these concepts for auditory fear conditioning in mice. We show that acquisition of conditioned fear by a few tone-shock pairings is accompanied by a nonassociative sensitization process. As a consequence, the freezing response of conditioned mice seems to be determined by both associative and nonassociative memory components. Our data suggest that the intensity of freezing as a function of footshock intensity is primarily determined by the nonassociative component, whereas the associative component is more or less categorical. We next demonstrate that the decrease in freezing on repeated nonreinforced tone presentation following conditioning shows fundamental properties of habituation. Thus, it might be regarded as a habituation-like process, which abolishes the influence of sensitization on the freezing response to the tone without affecting the expression of the associative memory component. Taken together, this study merges the dual-process theory of habituation with the concept of classical fear conditioning and demonstrates that sensitization and habituation as two nonassociative learning processes may critically determine the expression of conditioned fear in mice.


Figures

Figure 1.
Figure 1.
Neural circuits determining freezing to a tone following auditory fear conditioning. There are at least three different neural pathways, which may influence freezing to the tone. Firstly, a tone may reflexly elicit freezing via a direct pathway as a function of the stimulus intensity (unconditioned freezing). Secondly, presentation of a tone together with the footshock eventually leads to the formation of associative memories about the tone-footshock and the conditioning context-footshock contiguity (excitatory associative memory components, eAC). Subsequent tone presentation activates the eAC, and thus triggers a freezing response independently of direct tone effects on freezing. Noteworthy, generalization of the conditioning context to the test context might also influence the freezing response to the tone. Thirdly, an aversive encounter (e.g., electric footshock) leads to an activation of nonassociative memory components (NAC; sensitization). Subsequent nonreinforced tone presentation potentiates the unconditioned response to the tone via this pathway. Note that the NAC affect the processing of various stimuli in an unspecific manner.
Figure 2.
Figure 2.
Principles of extinction. The decreased expression of conditioned fear on a second nonreinforced tone presentation to conditioned mice might be attributed to at least four fundamentally different processes that are illustrated by means of the scheme of Figure 1. The thickness of the lines indicates the activity status of a given pathway. (A) Tone presentation after conditioning predicts the occurrence of the footshock. In absence of the expected punishment, conditioned mice eventually form an inhibitory association between tone and shock (iAC). Subsequent tone presentations trigger the iAC to inhibit the expression of excitatory associative memory components (eAC) that had been formed during fear conditioning (cf. Fig. 1). (B) Nonreinforced tone presentations might render the eAC labile again (reconsolidation). As a consequence, the original eAC might not be appropriately retrieved in the future. Under these circumstances, the freezing response to the tone would be determined primarily by nonassociative memory components formed during fear conditioning (NAC; sensitization; cf. Fig. 1). (C) A nonreinforced tone presentation reverses the modifications in the NAC (desensitization). After desensitization, the freezing response to a second nonreinforced tone presentation would be primarily determined by the eAC. Desensitization does not necessarily require tone presentation, but might also be triggered by other stimuli, or even occur spontaneously with the passage of time (decay). The consequences of desensitization are not specific for the freezing response to the tone, but affect also the processing of other stimuli. (D) Habituation in the direct pathway abolishes the potentiating influence of the NAC in a stimulus-specific manner. As a consequence, the freezing response on a second nonreinforced tone presentation is primarily determined by the eAC. Note that the NAC is still activated and might influence the behavioral response to other stimuli. It is likely that the four processes interact at multiple levels and determine extinction of conditioned fear in parallel, depending on the species, strain, and protocols.
Figure 3.
Figure 3.
Analysis of freezing behavior. (A) Mice were randomly assigned to three groups. One group remained nonshocked (naive mice). Two groups received a 0.70-mA footshock of 2-sec duration in the conditioning chamber at d0, either in combination with a 20-sec tone (conditioning procedure) or without tone presentation (sensitization procedure). At day 1, all mice were exposed to a 3-min tone (80 dB) in test context 1 (cf. Table 2). Tone presentation was preceded by a 3-min baseline period. The tone was designated CS0 for naive, CS+ for conditioned, and CSn for sensitized mice (cf. Table 1). Freezing before (pre-CS, Baseline) and during tone presentation (CS, Tone) was scored throughout the entire test session by typing preset keys on a computer keyboard. Periods of freezing are indicated for each individual subject (n = 10 per group; one subject per row) by black bars (ethogram). The length of the horizontal bars depicts the duration of a given freezing episode. Freezing was interrupted by bouts of activity. Some animals failed to show freezing at all. For statistical purposes, the individual freezing responses have been analyzed (B) as the sum of freezing shown over the entire 180 sec before and during tone presentation, respectively, and (C) in 20-sec intervals (corresponding to the length of CS+ at d0). Apparently, analysis in 20-sec intervals provides more information about the time course of the freezing response. For description of symbols and codes, see Tables 1 and 2. Mean ± SEM. Statistics for B: (*) P < 0.05, (***) P < 0.001 (paired t-test). Statistics for C: (*) P < 0.05, (***) P < 0.001 vs. the two other groups; + P < 0.05 vs. CS0 (2-way ANOVA for repeated measures, performed separately for baseline and for tone presentation, followed by Newman-Keuls post-hoc test).
Figure 4.
Figure 4.
Freezing to a tone in naive, sensitized, and conditioned mice. (A) Mice were randomly assigned to 11 groups (n = 10, each). Three groups of naive mice were exposed to 3-min tones of different intensity in test context 1. Four groups were sensitized in the conditioning chamber with 1 or 3 footshocks of different intensities (0.40, 0.55, or 0.70 mA). Four groups were conditioned with 1 or 3 tone-shock pairings in the conditioning chamber with shock intensities of 0.40, 0.55, or 0.70 mA. Group codes indicate shock intensity (first part) and number of shocks (second part). All sensitized and conditioned mice were exposed to a 3-min tone (80 dB) in test context 1 at day 1. Freezing of (B) naive, (C) sensitized, and (D) conditioned mice was analyzed in 20-sec intervals during the 3-min baseline period preceding tone presentation (open symbols) and during the 3-min tone presentation (filled symbols) and normalized to the analysis interval. Mice sensitized with three 0.55-mA shocks (0.55-3) or a single 0.70 mA shock (0.70-1) showed a similar freezing response to the tone, resulting in overlapping curves. The groups (1) naive mice with an 80-dB tone, and (2) sensitized, or (3) conditioned mice with a single 0.70-mA shock (0.70-1) are the same as in Figure 3. For description of symbols and codes, see Tables 1 and 2. Mean ± SEM. (°°) P < 0.01; (°°°) P < 0.001 vs. 95 dB; (a) P < 0.001 vs. the two other groups; (b) P < 0.05 vs. 98 dB; (*) P < 0.05 vs. all other groups; (+) P < 0.05 vs. 0.55-3 and 0.70-1 (2-way ANOVA for repeated measures, performed separately for baseline and for tone presentation, followed by Newman-Keuls post-hoc test).
Figure 5.
Figure 5.
Freezing shows a single-exponential decay over the course of a 3-min tone presentation at day 1. Data of Figure 4 were fitted with the single-exponential decay function F(t) = F0 * et, with F(t) representing the actual freezing response at a given time point t, F0 representing the initial freezing response and τ representing the decay constant. (A) Curve fitting for the freezing responses to tones of either 95 or 98 dB (CS0) measured in naive mice. Freezing responses to an 80-dB tone could not be fitted with the decay function. (B) Curve fittings for the freezing responses to an 80-dB tone (CSn) measured in sensitized mice. (C) Curve fittings for the freezing responses to a 80-dB tone (CS+) measured in conditioned mice. The freezing response showed the steepest decay during the first minute of tone presentation (gray area), reaching asymptotic levels toward the end of tone presentation. (D) The initial freezing response F0 and (E) the decay constant τ were calculated separately for each individual animal and averaged per group (mean ± SEM). Sensitization and conditioning groups with the same number [US(n)] and intensity [US(mA)] of the footshocks are plotted adjacently. A small number of animals had to be excluded from analysis, as the individual curve fitting failed to reach statistical significance. Therefore, the resulting sample sizes were 9 or 10 of 10 per group. (#) P < 0.01 vs. all other groups (ANOVA followed by Newman-Keuls post-hoc test); (**) P < 0.01 (Student's t-test).
Figure 6.
Figure 6.
Nonassociative, rather than associative memory components define the intensity of freezing to the tone following conditioning. (A) Freezing response during the first 60 sec of tone presentation at day 1 (mean ± SEM), measured in the same sensitized (CSn) and conditioned mice (CS+) as shown in Figures 4 and 5. Sensitization and conditioning groups, respectively, differed by the number [US(n)] and intensity [US(mA)] of the footshocks. Conditioned mice: (a) P < 0.001 vs. 0.40-3, P < 0.01 vs. 0.55-3, and P < 0.05 vs. 0.70-1; (b) P < 0.05 vs. 0.40-3 and 0.70-3. Sensitized mice: (c) P < 0.001 vs. all other groups (ANOVA followed by Newman-Keuls post-hoc test). (B) Using the data set shown in A, the mean freezing response of the respective sensitization group was subtracted from each individual freezing value of conditioned (open symbols) and sensitized mice (filled symbols). Thus, mean freezing responses of sensitization groups are set at zero (dotted line). Individual data with box plots indicate that the group differences between the conditioning groups seen in A disappear after this calculation. (C) Model for the interrelation between fear memory and intensity of the conditioning procedure. On the basis of the results of A and B, we propose that fear memory consists mainly of two summative components, an associative [association between tone and shock, (ac)] and a nonassociative component [sensitization due to the footshock, (nac)]. Values calculated under B suggest that conditioning with 1-3 tone-shock pairings leads to the formation of a categorical memory about the tone-shock association. The intensity of the footshock, in contrast, is predominantly encoded by sensitization.
Figure 7.
Figure 7.
Altered behavioral performance in a light-dark avoidance task following conditioning and sensitization procedures. (A) Mice were randomly assigned to three groups. At d0, all animals were placed into the conditioning chamber. Two groups received a single 0.70-mA footshock with (conditioning procedure) or without tone presentation (sensitization procedure). The third group did not receive a shock in the conditioning chamber. All animals were placed into test context 1 for 7 min without any tone presentation at d1, and into a light-dark avoidance box for 30 min at d7. The light-dark box was located in a different room and consisted of a light and a dark compartment of similar dimensions that were connected by a doorway. Several behavioral parameters were automatically recorded over the course of the 30-min light-dark test and analyzed in 3-min intervals. These behavioral parameters included (B) horizontal locomotion, (C) vertical exploration (rearings), (D) resting time (normalized to the observation period), (E) relative time spent in the dark compartment (normalized to the observation period), and (F) relative distance moved in the dark (normalized to the total horizontal locomotion shown in the respective observation period). For description of symbols and codes see Tables 1 and 2. Mean ± SEM. (n = 12 per group). (***) P < 0.001 nonshocked mice vs. the two other groups (2-way ANOVA for repeated measures, followed by Newman-Keuls post-hoc test).
Figure 8.
Figure 8.
Freezing of sensitized and conditioned mice on repeated tone presentation. (A) The same conditioned and sensitized mice shown in Figure 4 were exposed to the 3-min tone (80 dB) in test context 1 (cf. Table 2) for a second time, 6 d after the first exposure (d7). Conditioning and sensitization groups, respectively, differed in the number and intensity of the footshocks. Group codes indicate shock intensity (first part) and number of shocks (second part). (B) Conditioned mice showed a reduction in their freezing response to a tone (CS+) from d1 to d7. The significant group differences seen at d1 disappeared at d7. (C) Also, sensitized mice showed a reduction in their freezing response to a tone (CSn) from d1 to d7. Again, the significant group differences seen at d1 disappeared at d7. (D) Spontaneous recovery expressed as difference between the freezing value of the first 20-sec interval of tone presentation at day 7 and the freezing value of the last 20-sec interval of tone presentation at day 1. Conditioned mice showed, in general, more spontaneous recovery than sensitized mice. The intensity of the aversive encounter, however, had no influence on spontaneous recovery either in sensitized or in conditioned mice. Mean ± SEM. Freezing was analyzed in 20-sec bins and normalized to the length of the analysis interval. Freezing data at d1 are identical to those of Figure 4C,D. For description of symbols and codes see Tables 1 and 2.
Figure 9.
Figure 9.
Reduced freezing to the tone at day 7 requires prior tone presentation and does not depend on the extinction context. (A) In the first experimental series, naive mice were sensitized with a single 0.70-mA footshock in the conditioning chamber (d0). The next day (d1), mice were assigned to three groups (n = 9, each). The first group was subsequently exposed to a 3-min tone (80 dB) in test context 1, the second group remained undisturbed in their home cages, and the third group was placed into test context 1, but without tone presentation. Six days later (d7), all mice were exposed to a 3-min tone in test context 1. (B) Freezing response to the tones and to the respective silent periods shown by the mice of the first experimental series. Note that at d1, mice of the first group froze significantly more to the tone than mice of the third group to the test context. Moreover, the freezing response to the tone was independent of the familiarity with the test context and handling procedure, as mice of the third group showed essentially the same freezing to the tone at d7 as mice of the second group. (C) In the second experimental series, mice were frequently handled prior to the experiment. At d0, all mice were sensitized with three 0.70-mA footshocks in the conditioning chamber. The next day (d1), mice were assigned to two groups (n = 11-12) and placed into test context 1. Only one of the two groups was exposed to a 3-min tone (80 dB). Six days later (d7), both groups were placed into test context 2 and exposed to the 3-min tone. (D) Freezing response to the tones and to the respective silent periods shown by the mice of the second experimental series. Extensive handling before sensitization caused a general decrease in freezing to the tone (cf. Fig. 8C, group 0.70-3), but did not abolish the sensitization effects seen in the first experimental series (Fig. 9B). The decrease in freezing to the tone from d1 to d7 appeared to be unaffected by the test context. Data were analyzed in 20-sec bins and normalized to the length of the analysis interval. For description of symbols and codes, see Tables 1 and 2. Mean ± SEM. (*) P < 0.05; (**) P < 0.01; (***) P < 0.001 vs. the other group (2-way ANOVA for repeated measures, followed by Newman-Keuls post-hoc test).
Figure 10.
Figure 10.
No effect of tone presentation following conditioning and sensitization procedures on behavioral performance in a light-dark avoidance task. (A) Mice were randomly assigned to five groups. At d0, all animals were placed into the conditioning chambers. One group did not receive a shock (group I). Four groups received a single 0.70-mA footshock either with (conditioning procedures, groups II and III) or without tone presentation (sensitization procedures, groups IV and V). The next day (d1), all groups were placed into test context 1 (cf. Table 2) either without (groups I, II, and IV) or with subsequent presentation of a 3-min tone (80dB, groups III and V). Note that groups I, II, and IV are identical to those shown in Figure 7. At d7, all groups were tested in the light-dark avoidance task for 30 min. Several behavioral and autonomic parameters were recorded over the course of the 30-min light-dark test, including (B) horizontal locomotion, (C) vertical exploration (rearing), (D) resting time (normalized to the observation period), (E) relative time spent in the dark compartment (normalized to the observation period), and (F) defecation. For description of symbols and codes, see Tables 1 and 2. Mean ± SEM. (n = 12 per group). (a) P < 0.001 vs. all other groups; (b) P < 0.01 vs. groups III and IV, P < 0.001 vs. groups II and V; (c) P < 0.05 vs. group II; (d) P < 0.01 vs. groups III, IV, and V; (*) P < 0.05 (A-E: ANOVA, performed separately for groups I+II+III and I+IV+V, followed by Newman-Keuls post-hoc test; F: Kruskal-Wallis test followed by Dunn's post-hoc test).
Figure 11.
Figure 11.
Effects of tone presentation before conditioning on the freezing response to the tone. (A) Animals were randomly assigned to four groups. Naive mice of group I were repeatedly exposed to a 3-min tone of 98 dB in test context 1 at d1 and d7. Animals of group II were pre-exposed to the 3-min tone (80dB) in test context 1, followed by conditioning with a single 0.70-mA footshock at d0 and re-exposure to the 3-min tone the next day (d1). Mice of group III were exposed to the tone in test context 1 at d1 and d7 following conditioning. Mice of group IV were treated identically to group II, except for the tone intensity during tone pre-exposure at d-6 (95 dB instead of 80 dB). Note that group I is identical to group 98 dB of Figure 4B, group III with group 0.70-1 of Figure 4D, and group IV with group 95 dB of Figure 4B. (B) Reduced freezing to a loud tone on repeated tone presentation in naive mice (group I). (C) Reduced freezing to the tone on repeated tone presentation in conditioned mice (group III). (D) Pre-exposure to the tone led to a significantly reduced freezing response at d1 following conditioning (groups II and III). (E) The freezing response of group II at d1 was identical to that of group III at d7. (F) Pre-exposure to a loud tone had significantly less effects on freezing to the tone at d1 following conditioning than pre-exposure to a tone of the same intermediate intensity as used for conditioning and re-exposure to the tone at d1 (groups II and IV). For description of symbols and codes, see Tables 1 and 2. Data were analyzed in 20-sec bins and normalized to the length of the analysis interval. Mean ± SEM. (n = 10 per group). (*) P < 0.05; (***) P < 0.001 vs. the other group (2-way ANOVA for repeated measures, followed by Newman-Keuls post-hoc test).
Figure 12.
Figure 12.
Effects of tone presentation before sensitization and conditioning procedures on the freezing response to the tone. (A) Animals were randomly assigned to four groups. All mice were placed into test context 1 (cf. Table 2) at d-5. Two groups of mice were subsequently exposed to a 3-min tone (80 dB); the two other groups remained in the test context without tone presentation. Five days later (d0), one group with and one group without pre-exposure to the tone were sensitized with a single footshock (0.70 mA, 2 sec). The two other groups were conditioned with a single tone-shock association. All mice were exposed to 3-min tones (80 dB) in test context 1 at d1 and d7 and in test context 2 at d8 following sensitization and conditioning procedures, respectively. (B) Pre-exposure to the tone led to a significantly reduced freezing response at d1 following sensitization procedures (groups I and II). Both group I and group II showed virtually no freezing to the tone at d7. (C) Pre-exposure to the tone led to a significantly reduced freezing response at d1 following conditioning (groups III and IV). These group differences disappeared at d7. (D) The freezing response of group I at d7 was similar to that of group II at d1. The same was the case for the freezing response of group III at d7 and group IV at d1. (E) Freezing response to the tone at d1, d7, and d8. In all groups, freezing decreased from d1 to d7 and d8. Only in the case of group II, tone presentation in the unfamiliar test context 2 at d8 led to an increase in freezing compared with d7. (F) Defecation score (number of feces) counted at the end of the respective test trial. Freezing data were analyzed in 20-sec bins (B,C,D) or for the total 180-sec tone presentation (E) and normalized to the length of the respective analysis interval. For description of symbols and codes, see Tables 1 and 2. Mean ± SEM. (n = 10 per group). (*) P < 0.05; (**) P < 0.01; (***) P < 0.001 vs. the other group (1-way or 2-way ANOVA for repeated measures, followed by Newman-Keuls post-hoc test).
Figure 13.
Figure 13.
The two-component theory of fear conditioning. (A) In naive mice, the tone reflexly elicits freezing via the direct pathway. In addition, tone presentation might transiently activate nonassociative memory components (NAC), which, in turn, potentiate tone processing via the direct pathway (dual process theory of habituation; Groves and Thompson 1970). (B) In sensitized mice, chronically activated NAC potentiate the unconditioned fear response to the tone. (C) The two-component theory of fear conditioning predicts that fear conditioning causes the formation of both associative (eAC) and nonassociative memories (NAC) that enable the animals to separately encode qualitative (0/1, eAC) and quantitative information (NAC) about an aversive encounter. Consequently, two components of the fear memory, the eAC and the NAC, determine expression of the freezing response in conditioned mice. The thickness of the lines indicates the activity status of a given pathway. For further details see legend to Figure 1.

References

    1. Blair, H.T., Schafe, G.E., Bauer, E.P., Rodrigues, S.M., and LeDoux, J.E. 2001. Synaptic plasticity in the lateral amygdala: A cellular hypothesis of fear conditioning. Learn. Mem. 8: 229-242. - PubMed
    1. Blanchard, R.J., Griebel, G., Henrie, J.A., and Blanchard, D.C. 1997. Differentiation of anxiolytic and panicolytic drugs by effects on rat and mouse defense test batteries. Neurosci. Biobehav. Rev. 21: 783-789. - PubMed
    1. Boulis, N.M. and Davis, M. 1989. Footshock-induced sensitization of electrically elicited startle reflexes. Behav. Neurosci. 103: 504-508. - PubMed
    1. Cain, C.K., Blouin, A.M., and Barad, M. 2003. Temporally massed CS presentations generate more fear extinction than spaced presentations. J. Exp. Psychol. Anim. Behav. Process 29: 323-333. - PubMed
    1. Cordero, M.I. and Sandi, C. 1998. A role for brain glucocorticoid receptors in contextual fear conditioning: Dependence upon training intensity. Brain Res. 786: 11-17. - PubMed

Publication types

LinkOut - more resources