

Acid-sensing ion channel 2 contributes a major component to acid-evoked excitatory responses in spiral ganglion neurons and plays a role in noise susceptibility of mice
- PMID: 15537887
- PMCID: PMC6730178
- DOI: 10.1523/JNEUROSCI.3196-04.2004
Acid-sensing ion channel 2 contributes a major component to acid-evoked excitatory responses in spiral ganglion neurons and plays a role in noise susceptibility of mice
Abstract
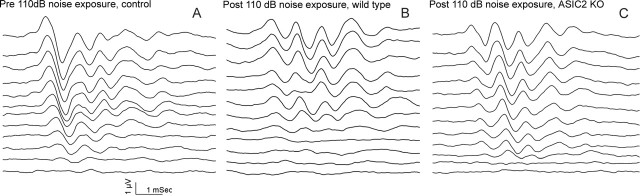
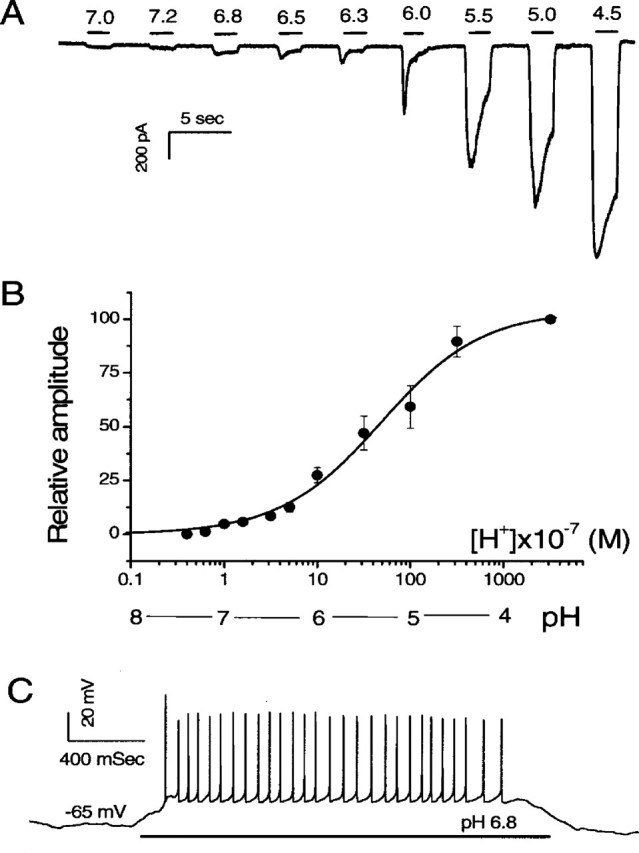
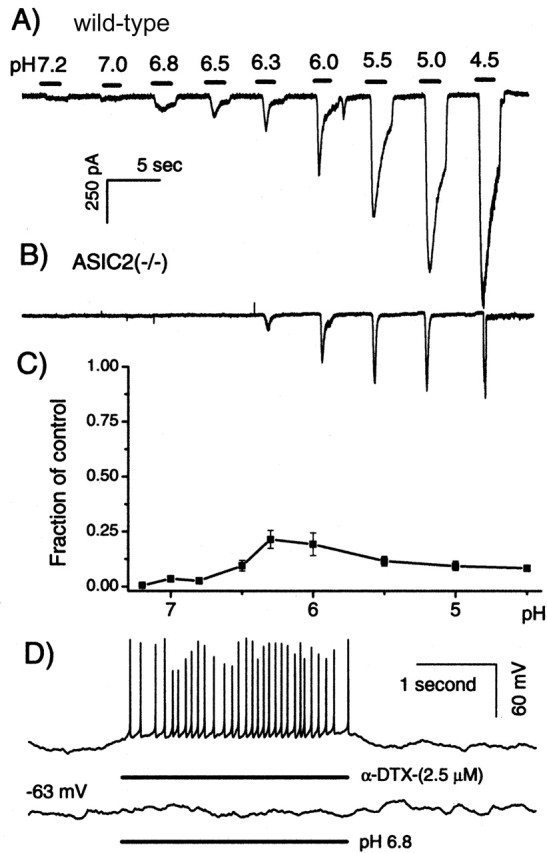
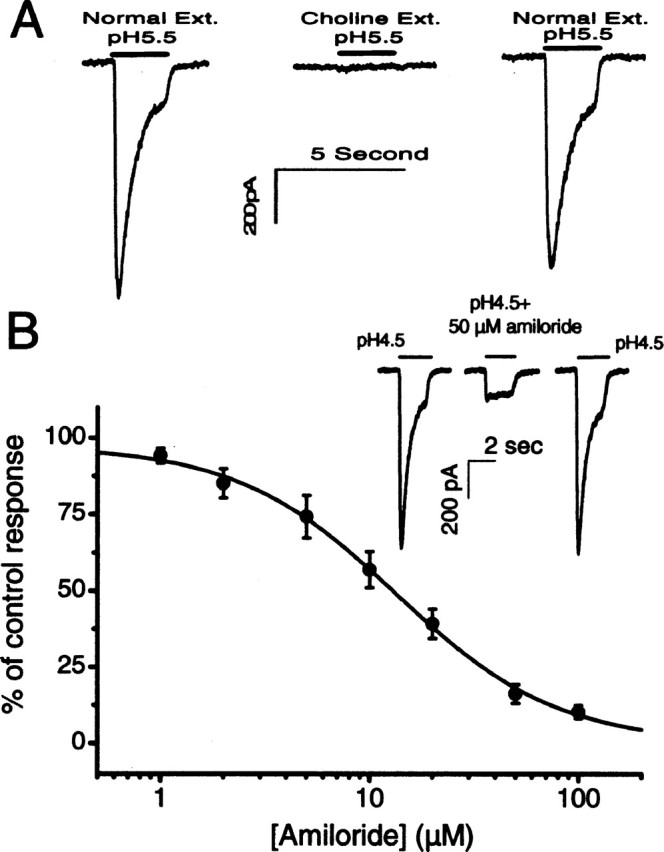
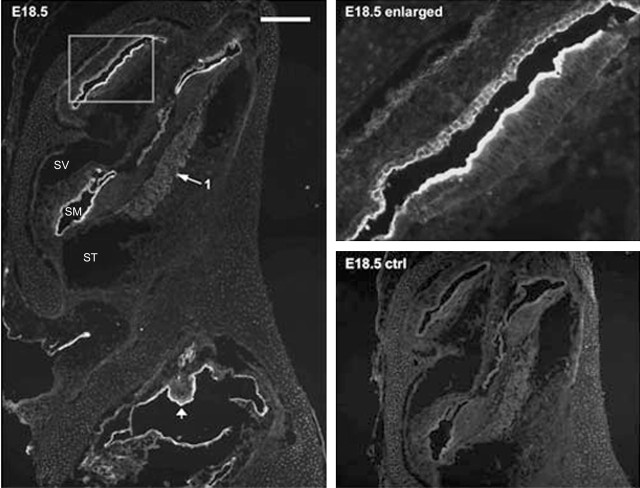
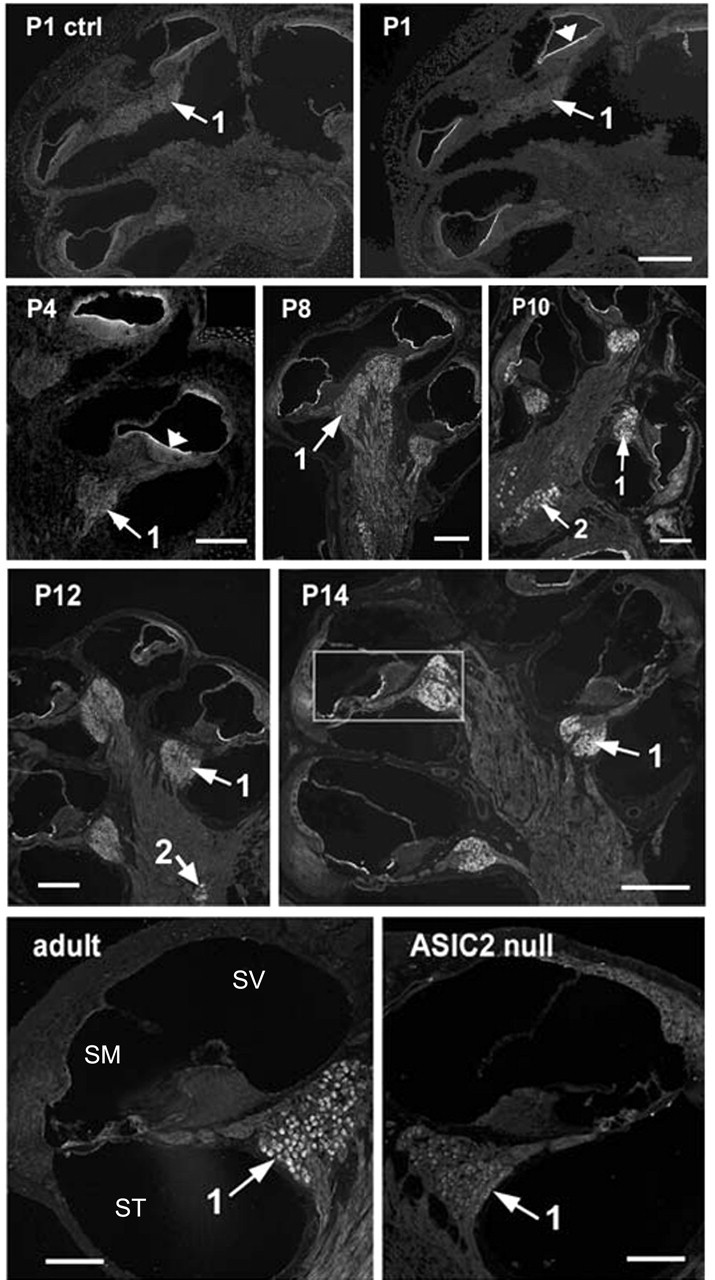
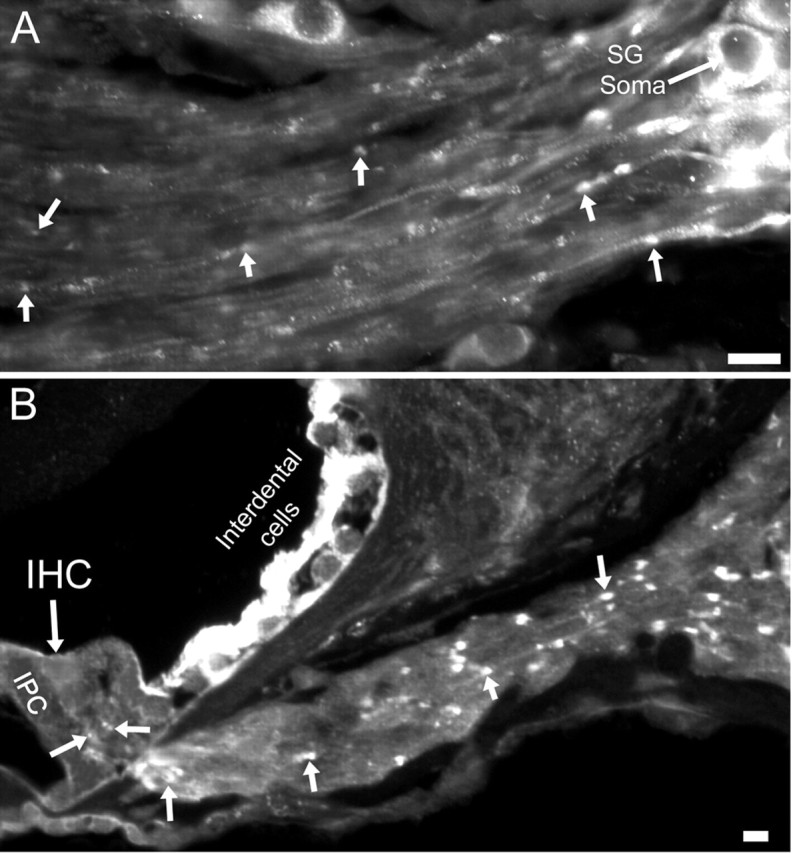
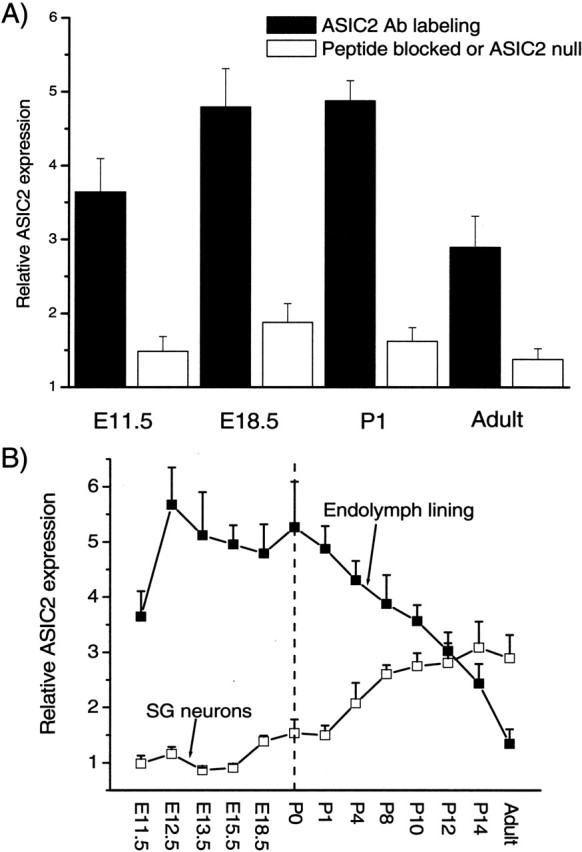
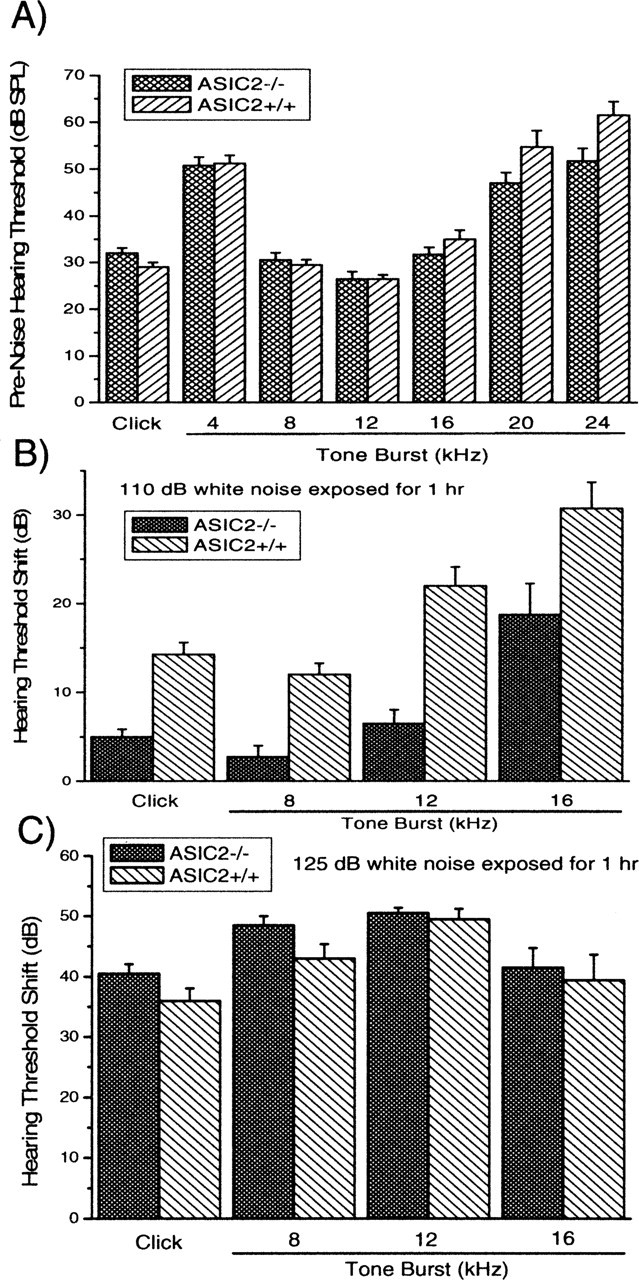
Ion channels in the degenerin-epithelial sodium channel (DEG-ENaC) family perform diverse functions, including mechanosensation. Here we explored the role of the vertebrate DEG-ENaC protein, acid-sensing ion channel 2 (ASIC2), in auditory transduction. Contributions of ASIC2 to hearing were examined by comparing hearing threshold and noise sensitivity of wild-type and ASIC2 null mice. ASIC2 null mice showed no significant hearing loss, indicating that the ASIC2 was not directly involved in the mechanotransduction of the mammalian cochlea. However, we found that (1) ASIC2 was present in the spiral ganglion (SG) neurons in the adult cochlea and that externally applied protons induced amiloride-sensitive sodium currents and action potentials in SG neurons in vitro, (2) proton-induced responses were greatly reduced in SG neurons obtained from ASIC2 null mice, indicating that activations of ASIC2 contributed a major portion of the proton-induced excitatory response in SG neurons, and (3) ASIC2 null mice were considerably more resistant to noise-induced temporary, but not permanent, threshold shifts. Together, these data suggest that ASIC2 contributes to suprathreshold functions of the cochlea. The presence of ASIC2 in SG neurons could provide sensors to directly convert local acidosis to excitatory responses, therefore offering a cellular mechanism linking hearing losses caused by many enigmatic causes (e.g., ischemia or inflammation of the inner ear) to excitotoxicity.
Figures
Similar articles
-
Acid-sensing ion channels ASIC2 and ASIC3 do not contribute to mechanically activated currents in mammalian sensory neurones.J Physiol. 2004 May 1;556(Pt 3):691-710. doi: 10.1113/jphysiol.2003.058693. Epub 2004 Feb 27. J Physiol. 2004. PMID: 14990679 Free PMC article.
-
Knockout of the ASIC2 channel in mice does not impair cutaneous mechanosensation, visceral mechanonociception and hearing.J Physiol. 2004 Jul 15;558(Pt 2):659-69. doi: 10.1113/jphysiol.2004.066001. Epub 2004 May 28. J Physiol. 2004. PMID: 15169849 Free PMC article.
-
Effects of quinine on the excitability and voltage-dependent currents of isolated spiral ganglion neurons in culture.J Neurophysiol. 1998 May;79(5):2503-12. doi: 10.1152/jn.1998.79.5.2503. J Neurophysiol. 1998. PMID: 9582223
-
The afferent signaling complex: Regulation of type I spiral ganglion neuron responses in the auditory periphery.Hear Res. 2016 Jun;336:1-16. doi: 10.1016/j.heares.2016.03.011. Epub 2016 Mar 25. Hear Res. 2016. PMID: 27018296 Review.
-
An acid-sensing ion channel that detects ischemic pain.Braz J Med Biol Res. 2005 Nov;38(11):1561-9. doi: 10.1590/s0100-879x2005001100001. Epub 2005 Oct 26. Braz J Med Biol Res. 2005. PMID: 16258623 Review.
Cited by
-
Acid-sensing ion channel 1a is a postsynaptic proton receptor that affects the density of dendritic spines.Proc Natl Acad Sci U S A. 2006 Oct 31;103(44):16556-61. doi: 10.1073/pnas.0608018103. Epub 2006 Oct 23. Proc Natl Acad Sci U S A. 2006. PMID: 17060608 Free PMC article.
-
Pathology and physiology of acid‑sensitive ion channels in the digestive system (Review).Int J Mol Med. 2022 Jul;50(1):94. doi: 10.3892/ijmm.2022.5150. Epub 2022 May 26. Int J Mol Med. 2022. PMID: 35616162 Free PMC article. Review.
-
Acid-Sensing Ion Channels Expression, Identity and Role in the Excitability of the Cochlear Afferent Neurons.Front Cell Neurosci. 2015 Dec 22;9:483. doi: 10.3389/fncel.2015.00483. eCollection 2015. Front Cell Neurosci. 2015. PMID: 26733809 Free PMC article.
-
Moderate exercise increases expression for sensory, adrenergic, and immune genes in chronic fatigue syndrome patients but not in normal subjects.J Pain. 2009 Oct;10(10):1099-112. doi: 10.1016/j.jpain.2009.06.003. Epub 2009 Jul 31. J Pain. 2009. PMID: 19647494 Free PMC article.
-
Restoration of connexin26 protein level in the cochlea completely rescues hearing in a mouse model of human connexin30-linked deafness.Proc Natl Acad Sci U S A. 2007 Jan 23;104(4):1337-41. doi: 10.1073/pnas.0606855104. Epub 2007 Jan 16. Proc Natl Acad Sci U S A. 2007. PMID: 17227867 Free PMC article.
References
-
- Bassilana F, Champigny G, Waldmann R, de Weille JR, Heurteaux C, Lazdunski M (1997) The acid-sensitive ionic channel subunit ASIC and the mammalian degenerin MDEG form a heteromultimeric H+-gated Na+ channel with novel properties. J Biol Chem 272: 28819-28822. - PubMed
-
- Chesler M, Kaila K (1992) Modulation of pH by neuronal activity. Trends Neurosci 15: 396-402. - PubMed
Publication types
MeSH terms
Substances
Grants and funding
LinkOut - more resources
Full Text Sources
Medical
Molecular Biology Databases