. 2004 Dec;16(12):3242-59.
doi: 10.1105/tpc.104.027466. Epub 2004 Nov 11.

FRAGILE FIBER3, an Arabidopsis gene encoding a type II inositol polyphosphate 5-phosphatase, is required for secondary wall synthesis and actin organization in fiber cells

Affiliations

FRAGILE FIBER3, an Arabidopsis gene encoding a type II inositol polyphosphate 5-phosphatase, is required for secondary wall synthesis and actin organization in fiber cells

Ruiqin Zhong et al. Plant Cell. 2004 Dec.

Abstract

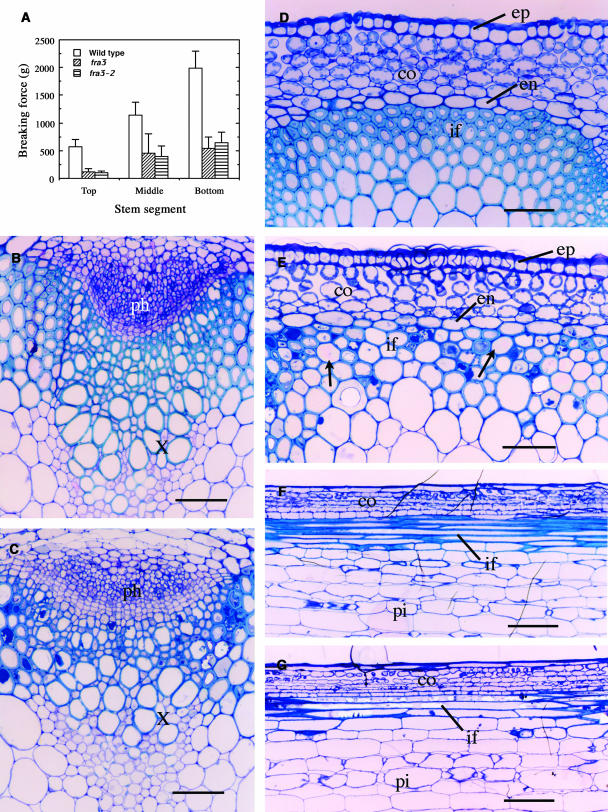
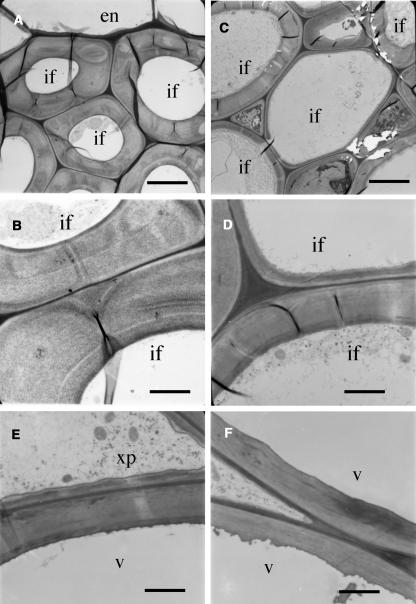
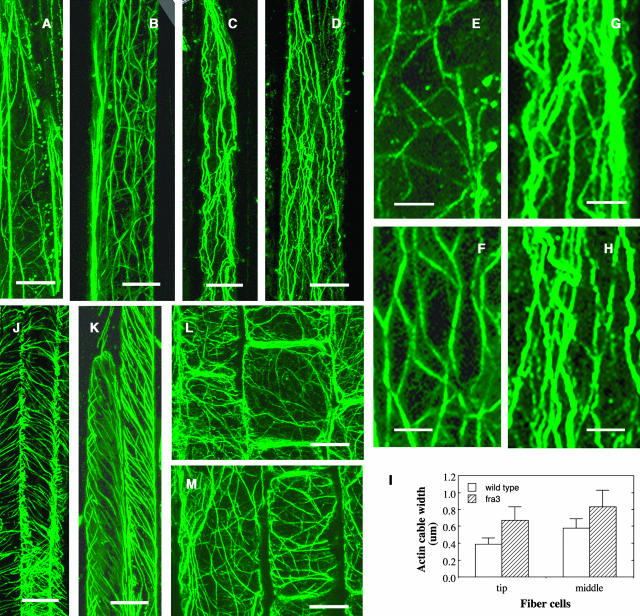
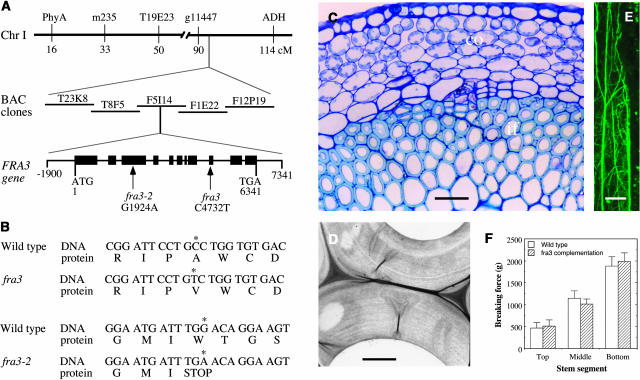
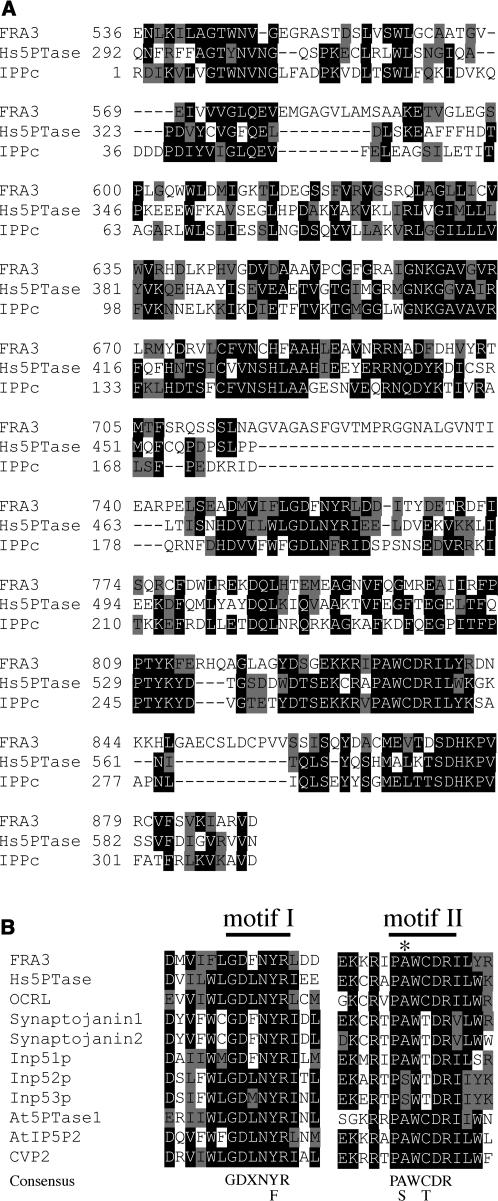
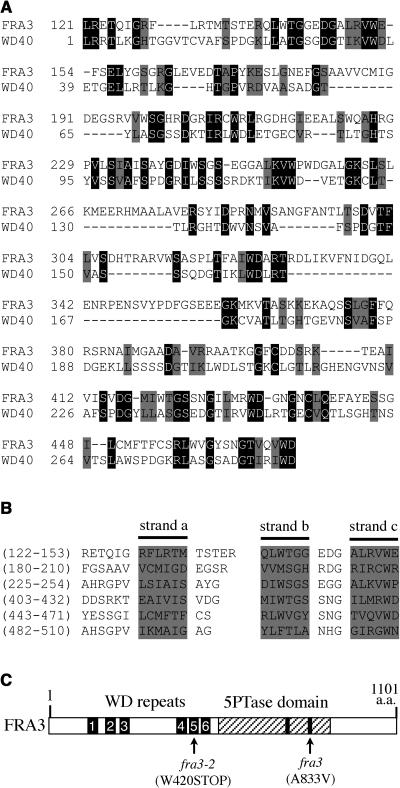
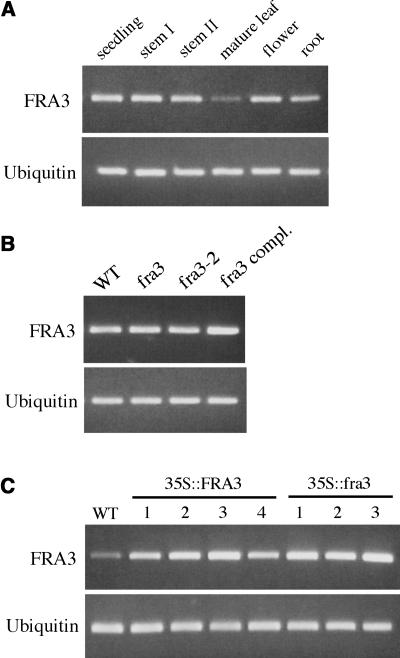
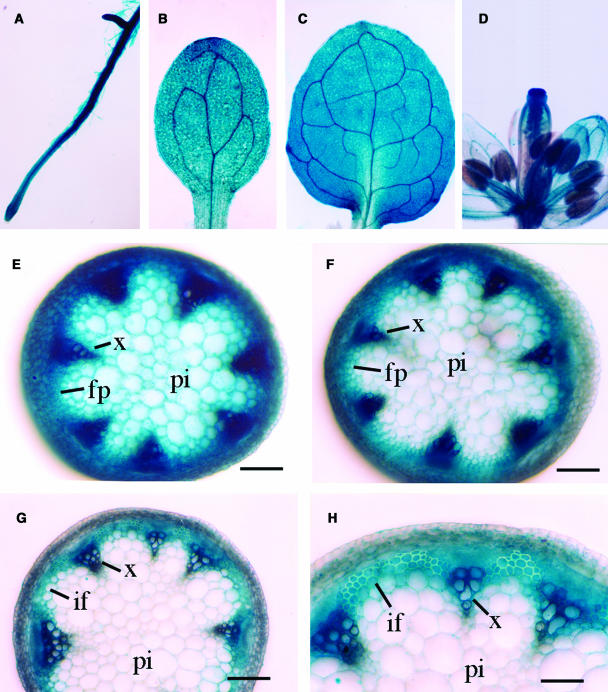
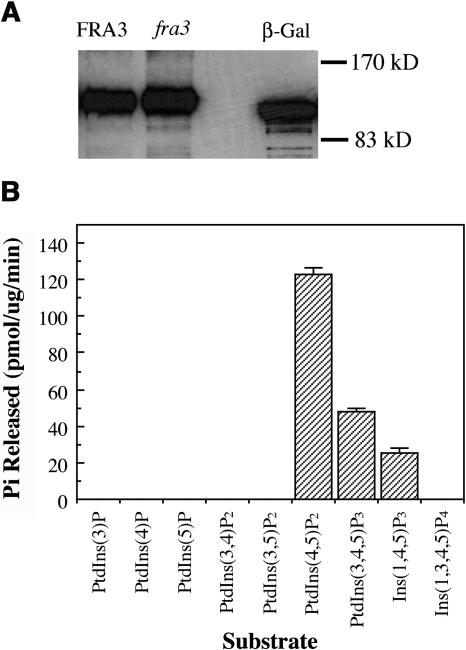
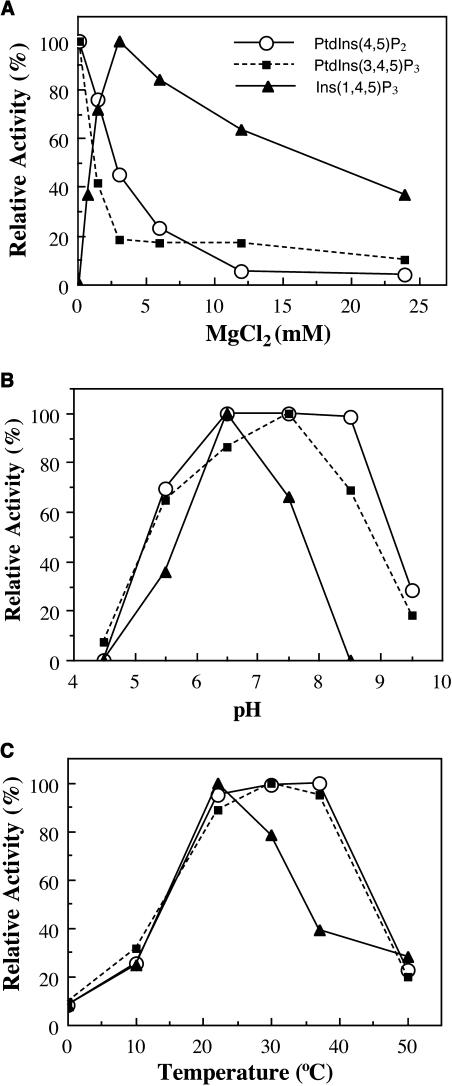
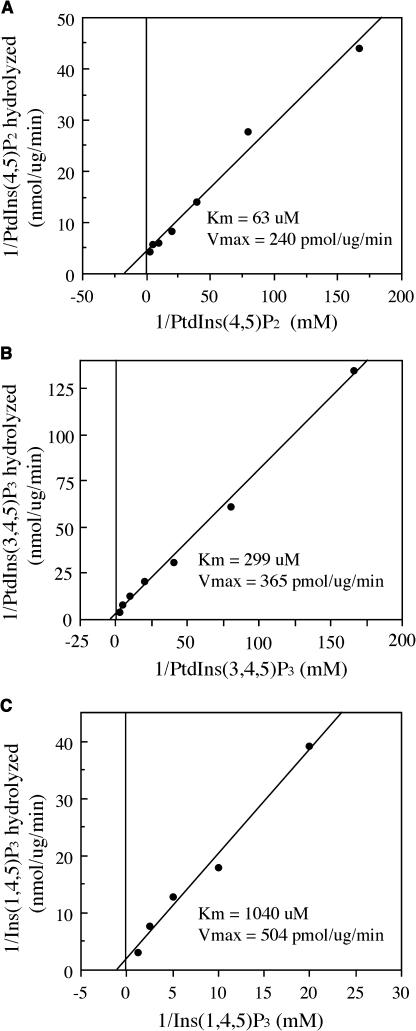
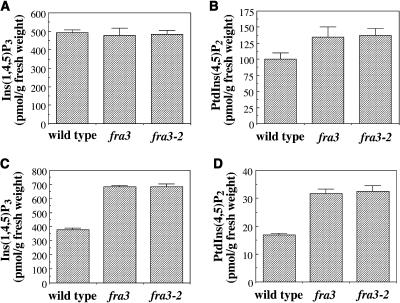
Type II inositol polyphosphate 5-phosphatases (5PTases) in yeast and animals have been known to regulate the level of phosphoinositides and thereby influence various cellular activities, such as vesicle trafficking and actin organization. In plants, little is known about the phosphatases involved in hydrolysis of phosphoinositides, and roles of type II 5PTases in plant cellular functions have not yet been characterized. In this study, we demonstrate that the FRAGILE FIBER3 (FRA3) gene of Arabidopsis thaliana, which encodes a type II 5PTase, plays an essential role in the secondary wall synthesis in fiber cells and xylem vessels. The fra3 mutations caused a dramatic reduction in secondary wall thickness and a concomitant decrease in stem strength. These phenotypes were associated with an alteration in actin organization in fiber cells. Consistent with the defective fiber and vessel phenotypes, the FRA3 gene was found to be highly expressed in fiber cells and vascular tissues in stems. The FRA3 protein is composed of two domains, an N-terminal localized WD-repeat domain and a C-terminal localized 5PTase catalytic domain. In vitro activity assay demonstrated that recombinant FRA3 exhibited phosphatase activity toward PtdIns(4,5)P2, PtdIns(3,4,5)P3, and Ins(1,4,5)P3, with the highest substrate affinity toward PtdIns(4,5)P2. The fra3 missense mutation, which caused an amino acid substitution in the conserved motif II of the 5PTase catalytic domain, completely abolished the FRA3 phosphatase activity. Moreover, the endogenous levels of PtdIns(4,5)2 and Ins(1,4,5)P3 were found to be elevated in fra3 stems. Together, our findings suggest that the FRA3 type II 5PTase is involved in phosphoinositide metabolism and influences secondary wall synthesis and actin organization.


Figures

Figure 1.
Figure 1.
Alterations of Stem Strength and Fiber Secondary Wall Thickness by the fra3 Mutation. Inflorescence stems of 8-week-old plants were used for breaking force measurement, and their bottom internodes were examined for fiber cell morphology. co, cortex; en, endodermis; ep, epidermis; if, interfascicular fiber; ph, phloem; pi, pith; x, xylem. Bars = 60 μm in (B) to (E) and 190 μm in (F) and (G). (A) Breaking force measurement showing that the force to break stems apart was about three times lower in fra3 and fra3-2 than in the wild type. (B) and (C) Cross sections of stems showing vascular bundles in the wild type (B) and fra3 (C). (D) Cross section of an interfascicular region of the wild type showing fiber cells with thick walls. (E) Cross section of an interfascicular region of fra3 showing fiber cells with thin walls. Note that some fiber cells (arrows) had extremely thinner walls. (F) and (G) Longitudinal sections of interfascicular regions showing long fiber cells in both the wild type (F) and fra3 (G).
Figure 2.
Figure 2.
Nonuniform Reduction of Secondary Wall Thickness in Fiber Cells of the fra3 Mutant. Fibers and vessels from the bottom internodes of 8-week-old plants were sectioned and examined for their wall thickness under a transmission electron microscope. en, endodermis; if, interfascicular fiber; v, vessel; xp, xylem parenchyma. Bars = 5.3 μm in (A) and (C) and 2.4 μm in (B), (D), (E), and (F). (A) and (B) Wild-type interfascicular fibers showing uniformly thick walls. High magnification of the walls is shown in (B). (C) and (D) fra3 interfascicular fibers showing nonuniform reduction of secondary wall thickness. High magnification of the walls is shown in (D). (E) and (F) Vessel walls were slightly thinner in fra3 (F) than in the wild type (E).
Figure 3.
Figure 3.
Alteration of F-Actin Organization in Developing Fiber Cells of the fra3 Mutant. Longitudinal sections of stems were immunolabeled for F-actin and microtubules with monoclonal antibodies against actin or α-tubulin and fluorescein isothiocyanate–conjugated secondary antibodies. Fluorescence-labeled F-actin and cortical microtubules were visualized under a confocal microscope. Bars = 18 μm in (A) to (D), 6 μm in (E) to (H), 11 μm in (J) and (K), and 12 μm in (L) and (M). (A) and (B) The tip (A) and middle (B) regions of a wild-type fiber cell showing fine F-actin network. (C) and (D) The tip (C) and middle (D) regions of a fra3 fiber cell showing thick F-actin cables. (E) and (F) High magnification of areas from (A) and (B), respectively, showing fine F-actin cables. (G) and (H) High magnification of areas from (C) and (D), respectively, showing thick F-actin cables. (I) Quantitative measurement of the width of fluorescence-labeled F-actin cables in the tip and middle regions of fiber cells. (J) and (K) Fiber cells showing cortical microtubules aligned in parallel in both the wild type (J) and fra3 (K). (L) and (M) Pith cells showing the fine F-actin network in both the wild type (L) and fra3 (M).
Figure 4.
Figure 4.
Map-Based Cloning of the FRA3 Gene and Complementation of the fra3 Mutant. (A) Map-based cloning of the FRA3 gene. The fra3 locus was mapped to a 27-kb region located in the BAC clone F5I14 on chromosome 1. The FRA3 gene consists of 11 exons and 10 introns. The fra3 mutation causes a C-to-T transition in the 9th exon, and the fra3-2 mutation results in a G-to-A transition in the 3rd exon. Black boxes represent exons and lines between exons denote introns in the FRA3 gene diagram. (B) Nucleotide and amino acid sequences around the fra3 mutation sites. The fra3 mutation changes a wild-type codon encoding Ala into a codon encoding Val. The fra3-2 mutation changes a wild-type codon encoding Trp into a stop codon. (C) Cross section of an interfascicular region of fra3 complemented with the wild-type FRA3 gene. Note the fiber cells with thick walls. The bottom internode of 8-week-old plants was used for sectioning. co, ortex; if, interfascicular fiber. Bar = 75 μm. (D) Thick walls of interfascicular fiber cells of fra3 complemented with the wild-type FRA3 gene. Bar = 2.2 μm. (E) Fine F-actin network in an interfascicular fiber cell of fra3 complemented with the wild-type FRA3 gene. F-actin was immunolabeled with a monoclonal antibody against actin and fluorescein isothiocyanate–conjugated secondary antibodies. Bar = 18 μm. (F) Breaking force measurement showing that the force to break stems apart was similar between the wild type and fra3 complemented with the wild-type FRA3 gene.
Figure 5.
Figure 5.
Sequence Analysis of the 5PTase Domain of FRA3. (A) Alignment of the 5-phosphatase domain of FRA3 with that of human type II 5PTase (Hs5PTase) and the conserved inositol polyphosphate phosphatase catalytic domain (IPPc, smart00128) from the GenBank conserved domain database. The numbers shown at the left of each sequence are the positions of amino acid residues in the corresponding proteins. Gaps (marked with dashes) were introduced to maximize the sequence alignment. Identical and similar amino acid residues are shaded with black and gray, respectively. (B) Sequence alignment of the two conserved 5-phosphatase catalytic motifs of FRA3 and other 5-phosphatases. The consensus sequences for the two motifs are shown below the aligned sequences. The fra3 mutation changes an Ala (marked with an asterisk) into Val in motif II. Shown in the alignment are motifs from type II 5PTases (Hs5PTase, OCRL, synaptojanin1, synaptojanin2, Inp51p, Inp52p, and Inp53p) and Arabidopsis 5PTases (At5PTase1, AtIP5P2, and CVP2).
Figure 6.
Figure 6.
Sequence Analysis of the WD Repeats of FRA3. (A) Sequence alignment of the N-terminal region of FRA3 with the conserved WD-repeat domain (WD40 domain, cd00200) from the GenBank conserved domain database. Gaps (marked with dashes) were introduced to maximize the sequence alignment. Identical and similar amino acid residues are shaded with black and gray, respectively. (B) Alignment of the six WD repeats in FRA3. The WD repeats were predicted using a program that identifies protein repeats. The shaded sequences shown in each repeat represent three of the four putative β strands (a, b, and c) as predicted with the secondary structure prediction program. (C) Diagram of the FRA3 protein showing the organization of the WD repeats and the 5-phosphatase domain. The numbered bars represent the six WD repeats. The hatched region represents the 5-phosphatase domain in which the two conserved motifs are marked with black bars. The fra3 and fra3-2 mutation sites are marked.
Figure 7.
Figure 7.
Gene Expression Analysis of FRA3 by Semiquantitative RT-PCR. (A) Expression of the FRA3 gene in various Arabidopsis organs. The expression level of a ubiquitin gene was used as an internal control. The seedlings used were 2 weeks old. Mature leaves were from 6-week-old plants. Flowers and mature roots were from 8-week-old plants. Stems I and II were from 4- and 8-week-old plants, respectively. (B) Expression of the FRA3 gene in seedlings of the wild type, fra3 mutants, and a representive fra3 complementation line (fra3 compl.). (C) Overexpression of wild-type FRA3 cDNA (35S::FRA3) or mutant fra3 cDNA (35S::fra3) in wild-type seedlings under the control of the 35S promoter of Cauliflower mosaic virus. Shown are four representative lines of 35S::FRA3 and three representative lines of 35S::fra3.
Figure 8.
Figure 8.
Gene Expression Analysis of FRA3 Using the GUS Reporter Gene. The FRA3 gene, including a 2-kb 5′ upstream sequence and the entire exon and intron region, was ligated in frame with the GUS reporter gene and transformed into wild-type Arabidopsis. Various organs from the transgenic plants were stained for GUS activity. fp, fiber precursor; if, interfascicular fiber; pi, pith; x, xylem. Bars = 165 μm in (E) to (G) and 330 μm in (H). (A) and (B) Primary root (A) and cotyledon (B) from 3-d-old seedlings showing the GUS staining in all tissues. (C) Leaf from 10-d-old seedlings showing the GUS staining in mesophyll cells and veins. (D) Flower showing the GUS staining in various floral parts. (E) Section from young elongating internodes showing GUS staining in all tissues. (F) Section from internodes at the stage near the cessation of elongation showing intensive GUS staining in vascular bundles and interfascicular regions. (G) Section from nonelongating internodes showing the GUS staining predominantly in vascular bundles and interfascicular fibers. (H) High magnification of (G) showing fiber cells with thick secondary walls and strong GUS staining.
Figure 9.
Figure 9.
FRA3 Exhibits Phosphatase Activity toward PtdIns(4,5)P2, PtdIns(3,4,5)P3, and Ins(1,4,5)P3. His-tagged full-length FRA3 protein was expressed in yeast, purified on a Ni-NTA column, and used for assay of its phosphatase activity. (A) Detection of recombinant FRA3 protein expressed in yeast. Shown are the His-tagged wild-type FRA3 protein (FRA3), fra3 mutant protein (fra3), and β-galactosidase (β-Gal). The recombinant proteins were detected with a monoclonal antibody against the Xpress epitope and horseradish peroxidase–labeled secondary antibodies. (B) Assay of the FRA3 phosphatase activity toward various phospholipids and two water-soluble inositol polyphosphates. FRA3 exhibits an apparent phosphatase activity toward PtdIns(4,5)P2, PtdIns(3,4,5)P3, and Ins(1,4,5)P3. No phosphatase activity was detected for the fra3 mutant protein. The recombinant β-galactosidase was used as a control in the assay.
Figure 10.
Figure 10.
Effects of Magnesium, pH, and Temperature on the FRA3 Phosphatase Activity. The FRA3 phosphatase activity was assayed in the presence of 50 μM substrates under various conditions as shown, and the data are presented as percentages of the highest value. The assays were run in duplicates and repeated twice. (A) Effects of Mg2+ concentration on the FRA3 phosphatase activity. Various concentrations of Mg2+ were included in the assay buffer. The lowest Mg2+ used for the activity assay was 0.1 mM as shown in the figure. (B) Effects of pH on the FRA3 phosphatase activity toward its substrates. (C) Effects of temperature on the FRA3 phosphatase activity toward its substrates.
Figure 11.
Figure 11.
Substrate Affinity of the FRA3 Phosphatase. The kinetic activity of FRA3 phosphatase was assayed in the presence of various concentrations of substrates. The results were analyzed by Lineweaver-Burk plots to determine the Km and Vmax values. (A) The kinetic property of FRA3 toward PtdIns(4,5)P2. PtdIns(4,5)P2 (6 to 400 μM) was incubated with 0.25 μg of recombinant FRA3 protein. (B) The kinetic property of FRA3 toward PtdIns(3,4,5)P3. PtdIns(3,4,5)P3 (6 to 400 μM) was incubated with 0.5 μg of recombinant FRA3 protein. (C) The kinetic property of FRA3 toward Ins(1,4,5)P3. Ins(1,4,5)P3 (50 to 800 μM) was incubated with 0.5 μg of recombinant FRA3 protein.
Figure 12.
Figure 12.
Measurement of the Endogenous Levels of Ins(1,4,5)P3 and PtdIns(4,5)P2 in the Wild Type and the fra3 Mutant. The seedlings used were 10 d old, and the inflorescence stems were from 8-week-old plants. The levels of Ins(1,4,5)P3 and PtdIns(4,5)P2 are expressed as picomoles per gram of fresh weight. (A) The level of Ins(1,4,5)P3 in wild-type and fra3 seedlings. (B) The level of PtdIns(4,5)P2 in wild-type and fra3 seedlings. (C) The level of Ins(1,4,5)P3 in wild-type and fra3 stems. (D) The level of PtdIns(4,5)P2 in wild-type and fra3 stems.

References

    1. Bechtold, N., and Bouchez, D. (1994). In planta Agrobacterium-mediated transformation of adult Arabidopsis thaliana plants by vacuum infiltration. In Gene Transfer to Plants, I. Potrykus, and G. Spangenberg, eds (Berlin: Springer-Verlag), pp. 19–23.
    1. Berdy, S.E., Kudla, J., Gruissem, W., and Gillaspy, G.E. (2001). Molecular characterization of At5Ptase1, an inositol phosphatase capable of terminating inositol triphosphate signaling. Plant Physiol. 126, 801–810. - PMC - PubMed
    1. Burnette, R.N., Gunesekera, B.M., and Gillaspy, G.E. (2003). An Arabidopsis inositol 5-phosphatase gain-of-function alters abscisic acid signaling. Plant Physiol. 132, 1011–1019. - PMC - PubMed
    1. Carland, F.M., and Nelson, T. (2004). COTYLEDON VASCULAR PATTERN2-mediated inositol (1,4,5) triphosphate signal transduction is essential for closed venation patterns of Arabidopsis floral organs. Plant Cell 16, 1263–1275. - PMC - PubMed
    1. Despres, B., Bouissonnié, F., Wu, H.-J., Gomord, V., Guilleminot, J., Grellet, F., Berger, F., Delseny, M., and Devic, M. (2003). Three SAC1-like genes show overlapping patterns of expression in Arabidopsis but are remarkably silent during embryo development. Plant J. 34, 293–306. - PubMed

Publication types

MeSH terms

Substances