. 2004 Nov;11(6):1045-53.
doi: 10.1128/CDLI.11.6.1045-1053.2004.

Establishment of diagnostic cutoff points for levels of serum antibodies to pertussis toxin, filamentous hemagglutinin, and fimbriae in adolescents and adults in the United States

Affiliations

Establishment of diagnostic cutoff points for levels of serum antibodies to pertussis toxin, filamentous hemagglutinin, and fimbriae in adolescents and adults in the United States

Andrew L Baughman et al. Clin Diagn Lab Immunol. 2004 Nov.

Abstract

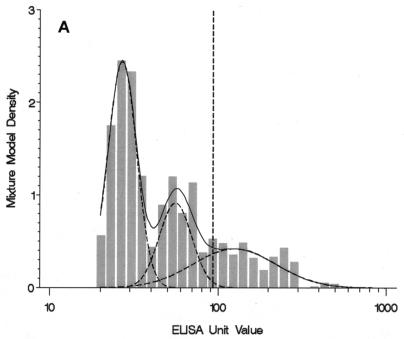
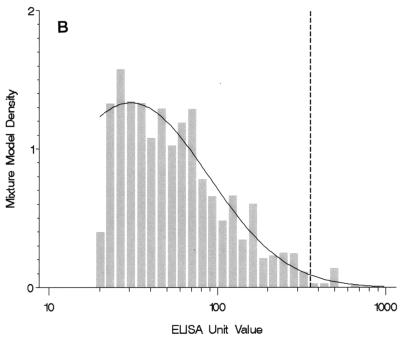
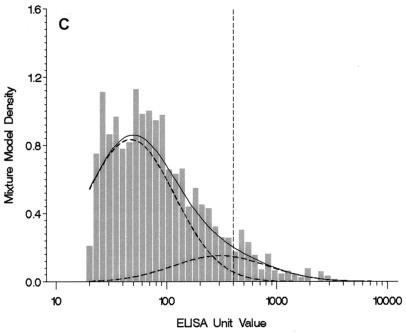
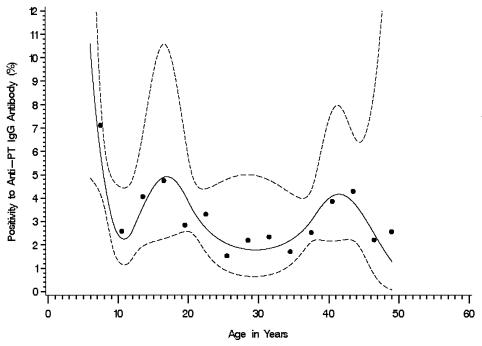
Numerous reports have documented that serologic methods are much more sensitive than culture for the diagnosis of pertussis in adolescents and adults. However, a standardized serologic test for pertussis is not routinely available to most clinicians, and the serologic test levels or cutoff points correlated with diseases have not been determined. The goal of the present study was to examine the distribution of immunoglobulin G (IgG) levels against three Bordetella pertussis antigens (pertussis toxin [PT], filamentous hemagglutinin [FHA], and fimbria types 2 and 3 [FIM]) and to determine population-based antibody levels for the purpose of establishing such diagnostic cutoff points. Enzyme-linked immunosorbent assays (ELISAs) were performed with sera from >6,000 U.S. residents aged 6 to 49 years who participated in the Third National Health and Nutrition Examination Survey. Mixture models were developed to identify hypothesized exposure groups and establish diagnostic cutoffs. Quantifiable (>20 ELISA units/ml [EU]) anti-FHA and anti-FIM IgG antibodies were common (65 and 62% of individuals, respectively), but quantifiable anti-PT IgG antibodies were less frequent (16%). Given the distributions of antibody levels, an anti-PT IgG level of > or =94 EU was proposed as the diagnostic cutoff point. Application of this cutoff point to culture-confirmed illness in a prior study investigating cough illness yielded a high diagnostic sensitivity (80%) and specificity (93%). A standardized ELISA for anti-PT IgG with a single serum sample appears to be useful for the identification of recent B. pertussis infection in adolescents and adults with cough illness. The PT cutoff point will be further evaluated in prospective studies of confirmed B. pertussis infection.


Figures

FIG. 1.
FIG. 1.
(A) Four-component mixture model fit for weighted anti-PT IgG levels among individuals 10 to 49 years of age (n = 5,409). The histogram graphs the observed data with values greater than the LLQ. Observed values less than or equal to the LLQ (85% of the sample size) and one observed value >1,000 EU are not shown. The solid line plots the mixture model fit for components 2, 3, and 4; component 1 is less than or equal to the LLQ and is not shown. The dashed lines indicate the underlying component populations in the mixture model. A reference dashed line is drawn at the selected cutoff point of 94 EU. (B) Two-component mixture model fit for weighted anti-FHA IgG levels among individuals 10 to 49 years of age (n = 5,399). The histogram graphs the observed data with values greater than the LLQ. Observed values less than or equal to the LLQ (58% of sample size) and two observed values >1,000 EU are not shown. The solid line plots the mixture model fit for component 2; component 1 is less than or equal to the LLQ and is not shown. A reference dashed line is drawn at the selected cutoff point of 358 EU. (C) Three-component mixture model fit for weighted anti-FIM IgG levels among individuals 10 to 49 years of age (n = 5,395). The histogram graphs the observed data with values greater than the LLQ. Observed values less than or equal to the LLQ (52% of sample size) are not shown. The solid line plots the mixture model fit for components 2 and 3; component 1 is less than or equal to the LLQ and is not shown. The dashed lines indicate the underlying component populations in the mixture model. A reference dashed line is drawn at the selected cutoff point of 402 EU.
FIG. 1.
FIG. 1.
(A) Four-component mixture model fit for weighted anti-PT IgG levels among individuals 10 to 49 years of age (n = 5,409). The histogram graphs the observed data with values greater than the LLQ. Observed values less than or equal to the LLQ (85% of the sample size) and one observed value >1,000 EU are not shown. The solid line plots the mixture model fit for components 2, 3, and 4; component 1 is less than or equal to the LLQ and is not shown. The dashed lines indicate the underlying component populations in the mixture model. A reference dashed line is drawn at the selected cutoff point of 94 EU. (B) Two-component mixture model fit for weighted anti-FHA IgG levels among individuals 10 to 49 years of age (n = 5,399). The histogram graphs the observed data with values greater than the LLQ. Observed values less than or equal to the LLQ (58% of sample size) and two observed values >1,000 EU are not shown. The solid line plots the mixture model fit for component 2; component 1 is less than or equal to the LLQ and is not shown. A reference dashed line is drawn at the selected cutoff point of 358 EU. (C) Three-component mixture model fit for weighted anti-FIM IgG levels among individuals 10 to 49 years of age (n = 5,395). The histogram graphs the observed data with values greater than the LLQ. Observed values less than or equal to the LLQ (52% of sample size) are not shown. The solid line plots the mixture model fit for components 2 and 3; component 1 is less than or equal to the LLQ and is not shown. The dashed lines indicate the underlying component populations in the mixture model. A reference dashed line is drawn at the selected cutoff point of 402 EU.
FIG. 2.
FIG. 2.
Weighted rate of a positive anti-PT IgG result (≥94 EU) by age at interview (6 to 49 years) (n = 6,030). The solid line indicates the fitted spline curve, and the dashed lines indicate the pointwise 95% confidence bands for the fitted spline curve. Each dot represents the observed data for subjects in a 3-year age group.

References

    1. Aricò, B., and R. Rappuoli. 1987. Bordetella parapertussis and Bordetella bronchiseptica contain transcriptionally silent pertussis toxin genes. J. Bacteriol. 169:2847-2853. - PMC - PubMed
    1. Cattaneo, L. A., G. W. Reed, D. H. Haase, M. J. Wills, and K. M. Edwards. 1996. The seroepidemiology of Bordetella pertussis infections: a study of persons ages 1-65 years. J. Infect. Dis. 173:1256-1259. - PubMed
    1. Centers for Disease Control and Prevention. 1997. Pertussis vaccination: use of acellular pertussis vaccines among infants and young children—recommendations of the Advisory Committee on Immunization Practices (ACIP). Morb. Mortal. Wkly. Rep. 46(RR-7):1-25. - PubMed
    1. Centers for Disease Control and Prevention. 2002. Pertussis—United States, 1997-2000. Morb. Mortal. Wkly. Rep. 51:73-76. - PubMed
    1. Cherry, J. D. 1999. Epidemiological, clinical, and laboratory aspects of pertussis in adults. Clin. Infect. Dis. 28(Suppl. 2):S112-S117. - PubMed

Publication types