

Line tension and interaction energies of membrane rafts calculated from lipid splay and tilt
- PMID: 15542550
- PMCID: PMC1305117
- DOI: 10.1529/biophysj.104.048223
Line tension and interaction energies of membrane rafts calculated from lipid splay and tilt
Abstract
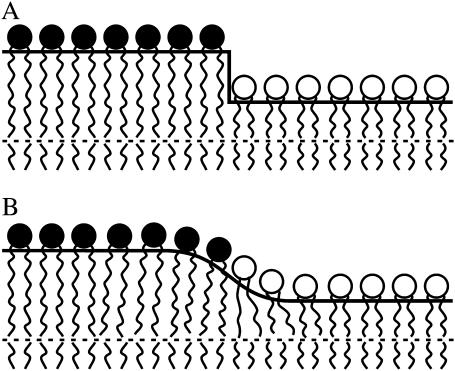
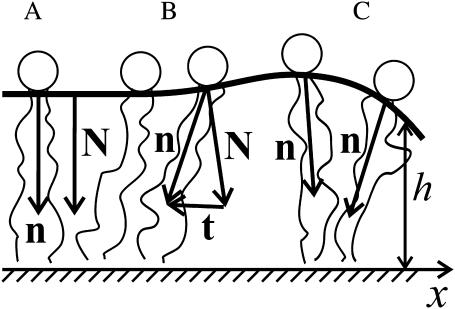
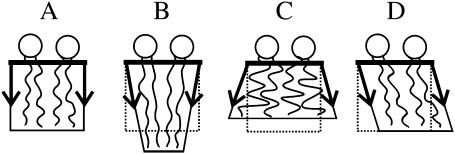
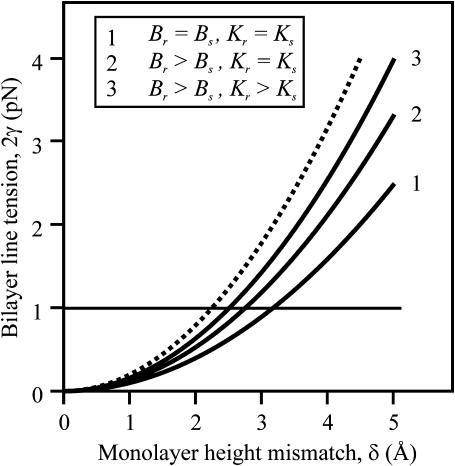
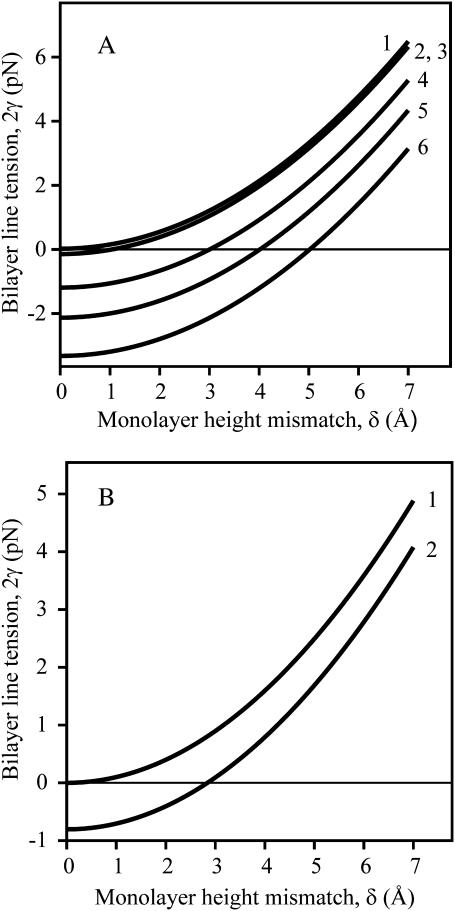
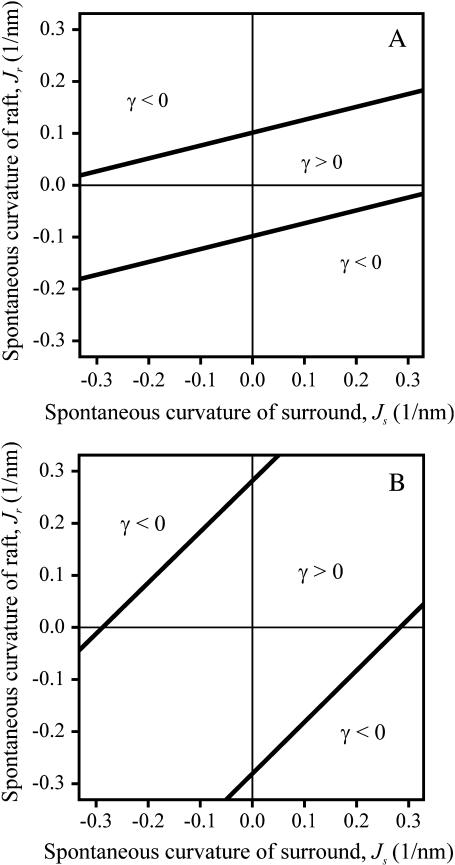
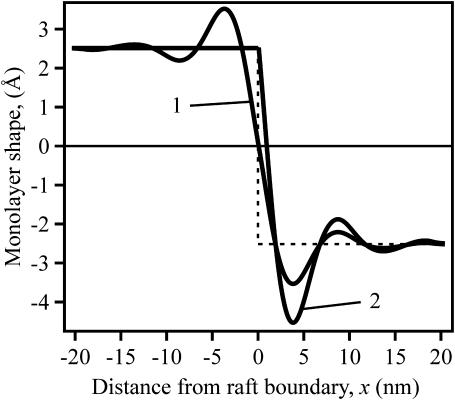
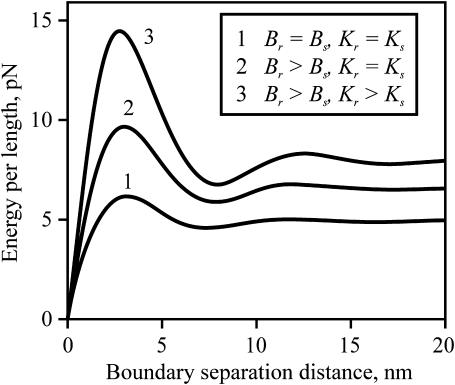
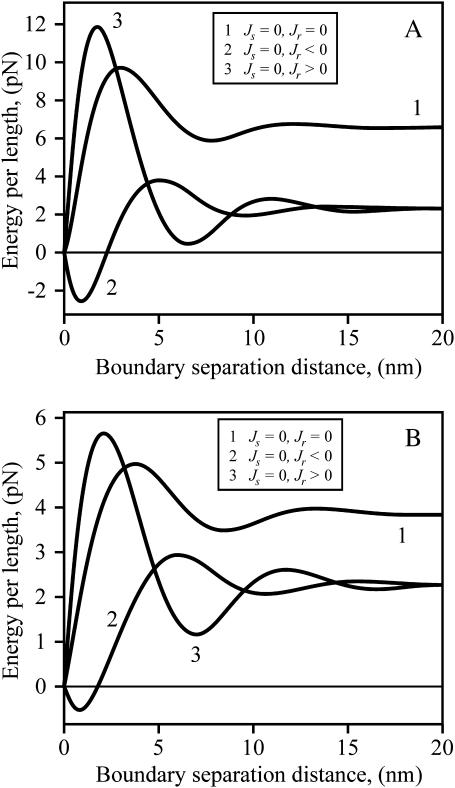
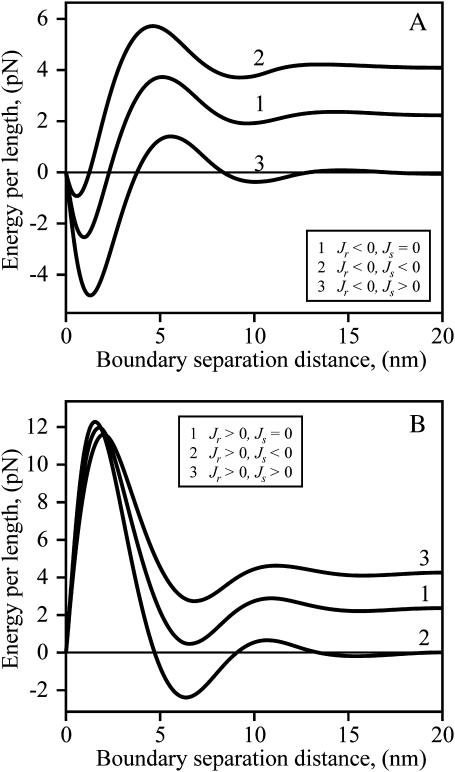
Membrane domains known as rafts are rich in cholesterol and sphingolipids, and are thought to be thicker than the surrounding membrane. If so, monolayers should elastically deform so as to avoid exposure of hydrophobic surfaces to water at the raft boundary. We calculated the energy of splay and tilt deformations necessary to avoid such hydrophobic exposure. The derived value of energy per unit length, the line tension gamma, depends on the elastic moduli of the raft and the surrounding membrane; it increases quadratically with the initial difference in thickness between the raft and surround; and it is reduced by differences, either positive or negative, in spontaneous curvature between the two. For zero spontaneous curvature, gamma is approximately 1 pN for a monolayer height mismatch of approximately 0.3 nm, in agreement with experimental measurement. Our model reveals conditions that could prevent rafts from forming, and a mechanism that can cause rafts to remain small. Prevention of raft formation is based on our finding that the calculated line tension is negative if the difference in spontaneous curvature for a raft and the surround is sufficiently large: rafts cannot form if gamma < 0 unless molecular interactions (ignored in the model) are strong enough to make the total line tension positive. Control of size is based on our finding that the height profile from raft to surround does not decrease monotonically, but rather exhibits a damped, oscillatory behavior. As an important consequence, the calculated energy of interaction between rafts also oscillates as it decreases with distance of separation, creating energy barriers between closely apposed rafts. The height of the primary barrier is a complex function of the spontaneous curvatures of the raft and the surround. This barrier can kinetically stabilize the rafts against merger. Our physical theory thus quantifies conditions that allow rafts to form, and further, defines the parameters that control raft merger.
Figures
Similar articles
-
Lateral tension increases the line tension between two domains in a lipid bilayer membrane.Phys Rev E Stat Nonlin Soft Matter Phys. 2007 Jan;75(1 Pt 1):011919. doi: 10.1103/PhysRevE.75.011919. Epub 2007 Jan 18. Phys Rev E Stat Nonlin Soft Matter Phys. 2007. PMID: 17358196
-
Monolayer curvature stabilizes nanoscale raft domains in mixed lipid bilayers.Proc Natl Acad Sci U S A. 2013 Mar 19;110(12):4476-81. doi: 10.1073/pnas.1221075110. Epub 2013 Mar 4. Proc Natl Acad Sci U S A. 2013. PMID: 23487780 Free PMC article.
-
Domain formation in membranes caused by lipid wetting of protein.Phys Rev E Stat Nonlin Soft Matter Phys. 2008 May;77(5 Pt 1):051901. doi: 10.1103/PhysRevE.77.051901. Epub 2008 May 1. Phys Rev E Stat Nonlin Soft Matter Phys. 2008. PMID: 18643096 Free PMC article.
-
The state of lipid rafts: from model membranes to cells.Annu Rev Biophys Biomol Struct. 2003;32:257-83. doi: 10.1146/annurev.biophys.32.110601.142439. Epub 2003 Jan 16. Annu Rev Biophys Biomol Struct. 2003. PMID: 12543707 Review.
-
Rafts making and rafts braking: how plant flavonoids may control membrane heterogeneity.Mol Cell Biochem. 2008 Jul;314(1-2):65-71. doi: 10.1007/s11010-008-9766-9. Epub 2008 Apr 15. Mol Cell Biochem. 2008. PMID: 18414995 Review.
Cited by
-
Lysolipids regulate raft size distribution.Front Mol Biosci. 2022 Oct 5;9:1021321. doi: 10.3389/fmolb.2022.1021321. eCollection 2022. Front Mol Biosci. 2022. PMID: 36275621 Free PMC article.
-
Clustering and lateral concentration of raft lipids by the MAL protein.Mol Biol Cell. 2009 Aug;20(16):3751-62. doi: 10.1091/mbc.e09-02-0142. Epub 2009 Jun 24. Mol Biol Cell. 2009. PMID: 19553470 Free PMC article.
-
The challenge of lipid rafts.J Lipid Res. 2009 Apr;50 Suppl(Suppl):S323-8. doi: 10.1194/jlr.R800040-JLR200. Epub 2008 Oct 27. J Lipid Res. 2009. PMID: 18955730 Free PMC article. Review.
-
Investigation of Nanoscopic Phase Separations in Lipid Membranes Using Inverse FCS.Biophys J. 2017 Jun 6;112(11):2367-2376. doi: 10.1016/j.bpj.2017.04.013. Biophys J. 2017. PMID: 28591609 Free PMC article.
-
A Model of Lipid Monolayer-Bilayer Fusion of Lipid Droplets and Peroxisomes.Membranes (Basel). 2022 Oct 13;12(10):992. doi: 10.3390/membranes12100992. Membranes (Basel). 2022. PMID: 36295751 Free PMC article.
References
-
- Akimov, S. A., P. I. Kuzmin, J. Zimmerberg, F. S. Cohen, and Y. A. Chizmadzhev. 2004. An elastic theory for line tension at a boundary separating two lipid monolayer regions of different thickness. J. Electroanal. Chem. 564:13–18.
-
- Anderson, R. G., and K. Jacobson. 2002. A role for lipid shells in targeting proteins to caveolae, rafts, and other lipid domains. Science. 296:1821–1825. - PubMed
-
- Baumgart, T., S. T. Hess, and W. W. Webb. 2003. Imaging coexisting fluid domains in biomembrane models coupling curvature and line tension. Nature. 425:821–824. - PubMed
-
- Bohinc, K., V. Kralj-Iglic, and S. May. 2003. Interaction between two cylindrical inclusions in a symmetric lipid bilayer. J. Chem. Phys. 119:7435–7444.
Publication types
MeSH terms
Substances
Grants and funding
LinkOut - more resources
Full Text Sources
Other Literature Sources
Research Materials
