Comparative Study
. 2005 Feb;88(2):880-902.
doi: 10.1529/biophysj.104.047431. Epub 2004 Nov 12.

Membrane-protein interactions in mechanosensitive channels

Affiliations
Comparative Study

Membrane-protein interactions in mechanosensitive channels

Paul Wiggins et al. Biophys J. 2005 Feb.

Abstract

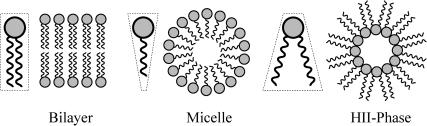
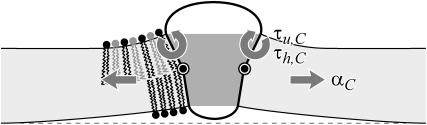
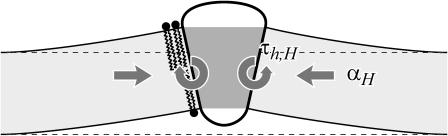
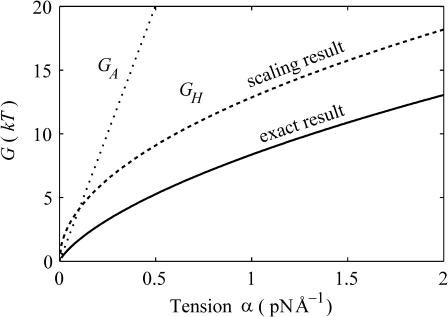
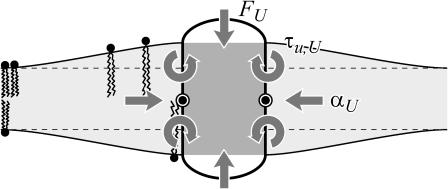
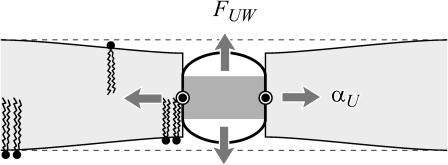
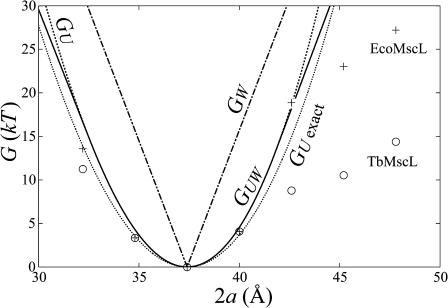
In this article, we examine the mechanical role of the lipid bilayer in ion channel conformation and function with specific reference to the case of the mechanosensitive channel of large conductance (MscL). In a recent article we argued that mechanotransduction very naturally arises from lipid-protein interactions by invoking a simple analytic model of the MscL channel and the surrounding lipid bilayer. In this article, we focus on improving and expanding this analytic framework for studying lipid-protein interactions with special attention to MscL. Our goal is to generate simple scaling relations which can be used to provide qualitative understanding of the role of membrane mechanics in protein function and to quantitatively interpret experimental results. For the MscL channel, we find that the free energies induced by lipid-protein interaction are of the same order as the measured free energy differences between conductance states. We therefore conclude that the mechanics of the bilayer plays an essential role in determining the conformation and function of the channel. Finally, we compare the predictions of our model to experimental results from the recent investigations of the MscL channel by a variety of investigators and suggest a suite of new experiments.


Figures

FIGURE 1
FIGURE 1
A schematic picture of the bilayer-inclusion model. The geometry of the inclusion is described by four parameters: the radius R, the thickness W, and the radial slopes H′± of the top and bottom surfaces of the bilayer, respectively. If the surfaces of the bilayer are locally normal to the interface of the inclusion, as depicted above, H′± = θ± in the small-angle approximation. The bilayer equilibrium thickness is 2a. The fields h ± (r) are the z displacements of the top and bottom surfaces of the bilayer, respectively. Their average is the midplane displacement, h(r), and half their difference is u(r) + a. The value u(r) is the local thickness deformation of a single leaflet of the bilayer. At the interface, twice this deformation, 2U, is the hydrophobic mismatch, W − 2a. The generalized forces on the inclusion induced by the bilayer are depicted for positive values. F is the expansion-compression force, α is the tension, τh is the midplane torque, and τu is the shape torque.
FIGURE 2
FIGURE 2
Models of the closed and open states colored by hydrophobicity (Sukharev et al., 2001). Although the general region spanned by the membrane is evident from the hydrophobic regions on the protein interface, it is difficult to precisely define the thickness of this region. A closed-state thickness has been inferred from the data of Powl et al. (2003) and this region is schematically marked on the model of the closed state. Additional confirmation of this estimate for the hydrophobic thickness comes from the simulation of Elmore and Dougherty (2003).
FIGURE 3
FIGURE 3
A cartoon of areal deformation. Tension, represented by the arrows, is transmitted through the bilayer to the inclusion. For positive biaxial tension, radial expansion of the inclusion reduces the free energy of the bilayer. The vesicle or cell can be viewed as a bilayer reservoir where tension is the energetic cost per unit area of bilayer in the local system.
FIGURE 4
FIGURE 4
The theoretical areal deformation free energies for the open (dashed line) and closed state (solid line) as a function of applied tension.
FIGURE 5
FIGURE 5
A schematic depiction of molecular shapes which influence spontaneous curvature (Israelachvili, 1991). Molecules with a cylindrical shape, such as phospholipids, will assemble into bilayers. Cone shaped molecules, such as lysophospholipids will assemble into micelles, the lowest energy configurations. For our sign conventions, these cone-shaped molecules induce negative spontaneous curvature. Inverted cone-shaped molecules, such as cholesterol, DOPC, and DOPE assemble into HII phases (Gruner, 1989) and induce positive spontaneous curvatures. The size of the spontaneous curvature is thought to be related to the difference in size between the polar headgroup and the acyl tails. Figure adapted from Lundbæk and Andersen (1994).
FIGURE 6
FIGURE 6
A schematic depiction of spontaneous curvature induced by several species of lipids in the bilayer. The shaded lipids depict a nonbilayer lipid which induces positive spontaneous curvature. A tilted inclusion interface can lead to a reduction in the stress caused by the nonbilayer lipids as depicted above. Spontaneous curvature induces both torques and tension at the interface. For energetically favorable tilt, the tension acts to open the channel. The torque on the inclusion from a bilayer leaflet with positive spontaneous curvature acts to increase tilt by expansive pressure at the surface and compressive pressure at the midplane. When only one leaflet of the bilayer is doped, both a midplane and a shape torque are induced but they cancel for the undoped leaflet.
FIGURE 7
FIGURE 7
The spontaneous curvature free energy as a function of the composite spontaneous curvature C for various midplane slopes. At the top we have shown the corresponding concentration ratio for the DOPE/DOPC system of Keller et al. (1993). For positive C, the bottom leaflet consists of pure DOPC and the top leaflet is a DOPE/DOPC mix with mole fraction x of DOPE. For negative C, the top leaflet consists of pure DOPC and the bottom leaflet is a DOPE/DOPC mix with mole fraction x′ of DOPE. We have plotted the free energy for a range of spontaneous curvatures that are larger than those that can be realized for DOPC/DOPE bilayers, since they may be relevant for other lipids or detergent-lipid bilayers.
FIGURE 8
FIGURE 8
A conically shaped protein induces bilayer bending. To match a conical inclusion interface, the bilayer must deform. The deformation leads to energetic contributions both from an increase in bilayer area and from bilayer bending. Midplane deformation induces both a midplane torque and a tension. The tension is always compressive. The midplane torque acts to reduce interface tilt and restore the bilayer to its undeformed configuration. We estimate that the midplane deformation energy is probably not important for MscL gating.
FIGURE 9
FIGURE 9
The midplane deformation energy is illustrated above as a function of tension. We have plotted the approximate scaling result (dashed line) discussed below, the exact result to the model (solid line) discussed in Calculation of Free Energy (see Appendix), as well as the areal deformation energy for the closed state, the opening tension α* (dotted line). All the energies are computed for the closed state using an unrealistically large midplane slope (H = 0.5) to exaggerate the effect. Although the scaling result is several kT larger than the exact result, it accurately reflects the scaling at high tension, and provides a limit for the exact result. The α1/2 dependence of the midplane deformation energy has not been observed experimentally.
FIGURE 10
FIGURE 10
Bilayer thickness deformation due to a hydrophobic mismatch. To match the inclusion's hydrophobic boundary, the bilayer thickness must be deformed. Microscopically, the lipid tails are deformed as illustrated schematically above. The modulus for these deformations is KA. For large mismatches, the energy contribution from thickness deformation can be quite significant. We estimate that this energy is important for MscL gating. Thickness deformation induces a compression-expansion force, a tension, and a shape torque, which are also depicted above. The compression-expansion force acts to reduce the mismatch. The shape torque acts to induce interface tilt to reduce the bilayer bending. The tension generated by a mismatch is always compressive.
FIGURE 11
FIGURE 11
Bilayer thickness deformation saturates when the energy required to further deform the membrane is equal to the interface energy required to create a hydrophobic-hydrophilic interface. This failure of the bilayer to conform to the protein is depicted schematically above.
FIGURE 12
FIGURE 12
Interface and thickness deformation energy of the closed state compared to experimental data from Powl et al. (2003) as a function of lipid bilayer thickness. The dot-dashed curve is the hydrophobic interface energy (GW) without thickness deformation (the limit is 𝒦 → ∞). The dotted curve is the exact thickness deformation energy (GU exact) without saturation. The dashed curve is the asymptotic thickness deformation energy (GU) without saturation (the limit is σ* → ∞). The solid curve is the saturating thickness deformation energy (GUW, see the Appendix for details). The o and + symbols are the experimental values measured by Powl and co-workers for TbMscL and EcoMscL, respectively. We have chosen the closed-state thickness of the channel (WC = 37.5 Å) to match the thickness of the bilayer at the minimum of the experimental bilayer deformation energy. This thickness is compatible with the known closed-state structure. For small mismatches there is a much better qualitative agreement between the thickness deformation energy than the hydrophobic interface theory. For large mismatch, the experimental data points are significantly smaller than the energy predicted by theory. We discuss this apparent discrepancy in the next section.
FIGURE 13
FIGURE 13
The theoretical free energy difference compared to the experimental data of Perozo et al. (2002a) for different choices of the geometric parameters characterizing the open-state thickness. The thickness deformation energy is plotted for a closed-state thickness of WC = 37.5 Å and several different open-state thicknesses. Each curve is shifted to pass through the data point at an acyl-chain length of 16. An open-state thickness of WO ∼ 36 Å gave a reasonable fit to the experimental data. Perozo and co-workers also have electron paramagnetic resonance data for bilayers with acyl-chain lengths n ≥ 10, which suggest that the channel is closed (ΔG ≥ 0) in the absence of applied tension.
FIGURE 14
FIGURE 14
The theoretical line tension for MscL compared with the line tension estimated from the measurements of East and Lee (1982), O'Keeffe et al. (2000), and Powl et al. (2003). The experimental data for several different proteins has been aligned so that the minimum line tension is assumed to correspond to zero mismatch. In the small mismatch regime, there is very reasonable agreement between theory and the measurements. At large mismatch the story becomes more complicated. There is significant variation between proteins, and even between Eco and Tb MscL. These variations may signal conformational changes in the protein. The methods of East and Lee are only sensitive to the free energy in the first layer of lipids surrounding the proteins. It is therefore natural to expect the theoretical line tension to be larger than the measured line tension. We have plotted the saturating thickness deformation energy (GUW) for interface energies σ = ∞ (solid), σ = σ* (dotted), and σ = σ*/2 (dashed), because σ* probably underestimates the saturation effect since the interface of the bilayer which would initially be exposed to solvent is not extremely hydrophobic (e.g., White and Wimley, 1999).
FIGURE 15
FIGURE 15
Accuracy of lipid model. In the top panel, we plot lipid bilayer thickness versus acyl-chain width. There is reasonable agreement between the linear fit and the data, provided that the lipid is not polyunsaturated. In the bottom panel the effective spring constant 𝒦 is plotted versus lipid bilayer width. 𝒦 is approximately independent of the bilayer thickness. All data is from Rawicz et al. (2000).
FIGURE 16
FIGURE 16
Validity of asymptotic approximation for dimensionless thickness deformation free energy. The curves above depict the difference between the exact result (Eq. 116, solid curve), the asymptotic expansion (Eq. 118, dashed curve), and the dominant scaling result (shown in Table 1, dotted curve). There is excellent agreement between the approximate result and exact result for radii relevant for MscL: formula image
FIGURE 17
FIGURE 17
Validity of asymptotic approximation for dimensionless midplane deformation free energy (Eq. 126). The curves above depict the difference between the exact result (Eq. 124, solid curve), the asymptotic expansion (Eq. 125, dashed curve), and the dominant scaling result (Table 1, dotted line). For MscL the prefactor πKBH2 is typically <1 kT, implying that the greatest error (when the tension is 0) is a fraction of a kT at most.

References

    1. Bass, R. B., P. Srop, M. Barclay, and D. C. Rees. 2002. Crystal structure of Escherichia coli MscS, a voltage-modulated and mechanosensitive channel. Science. 298:1582–1587. - PubMed
    1. Betanzos, M., C. S. Chiang, H. R. Guy, and S. Sukharev. 2002. A large iris-like expansion of a mechanosensitive channel protein induced by membrane tension. Nat. Struct. Biol. 9:704–710. - PubMed
    1. Bilston, L. E., and K. Mylvaganam. 2002. Molecular simulations of the large conductance mechanosensitive (MscL) channel under mechanical loading. FEBS Lett. 512:185–190. - PubMed
    1. Blount, P., and P. C. Moe. 1999. Bacterial mechanosensitive channels: integrating physiology, structure and function. Trends Microbiol. 7:420–424. - PubMed
    1. Boal, D. 2002. Mechanics of the Cell. Cambridge University Press, Cambridge, UK.

Publication types

LinkOut - more resources