. 2004 Dec;78(23):12817-28.
doi: 10.1128/JVI.78.23.12817-12828.2004.

Multiple genotypes of influenza B virus circulated between 1979 and 2003

Affiliations

Multiple genotypes of influenza B virus circulated between 1979 and 2003

Jonathan A McCullers et al. J Virol. 2004 Dec.

Erratum in

  • J Virol. 2005 May;79(9):5886

Abstract

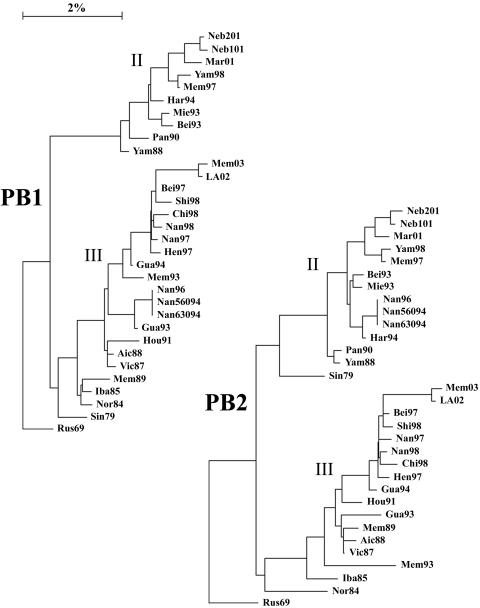
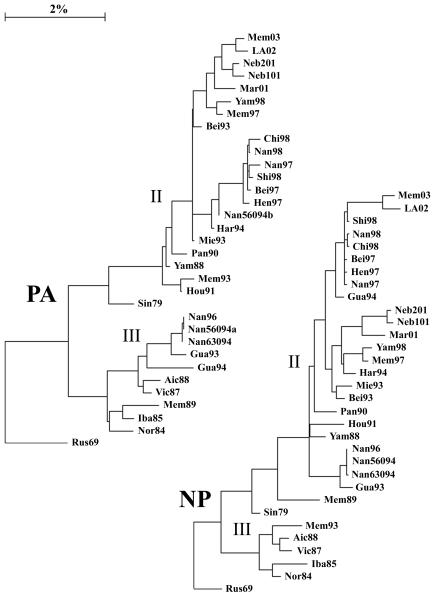
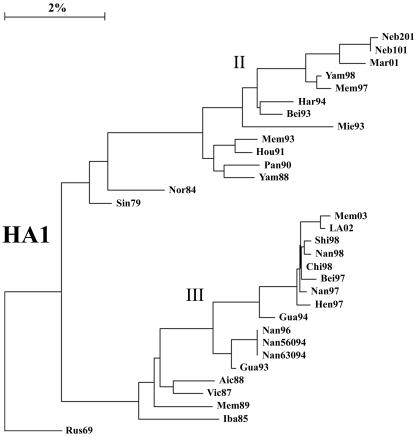
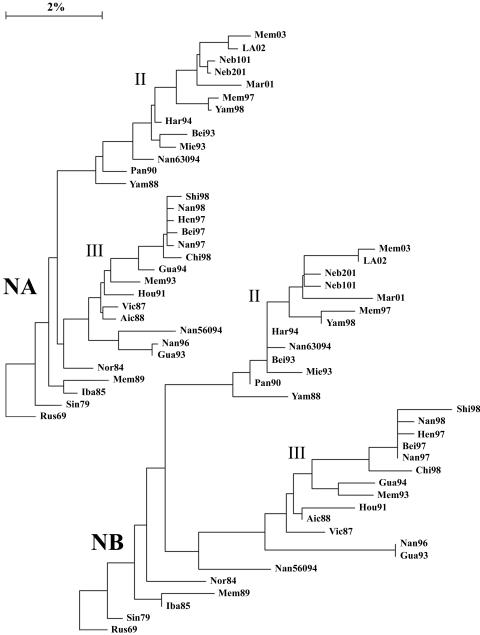
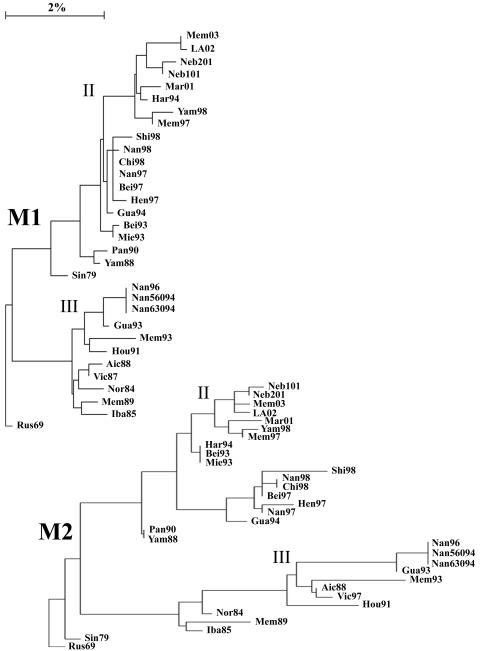
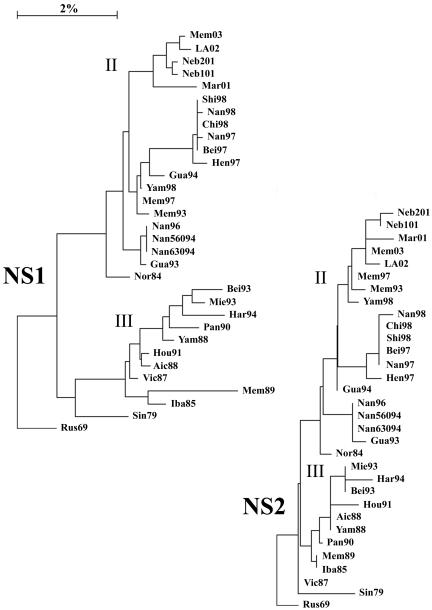
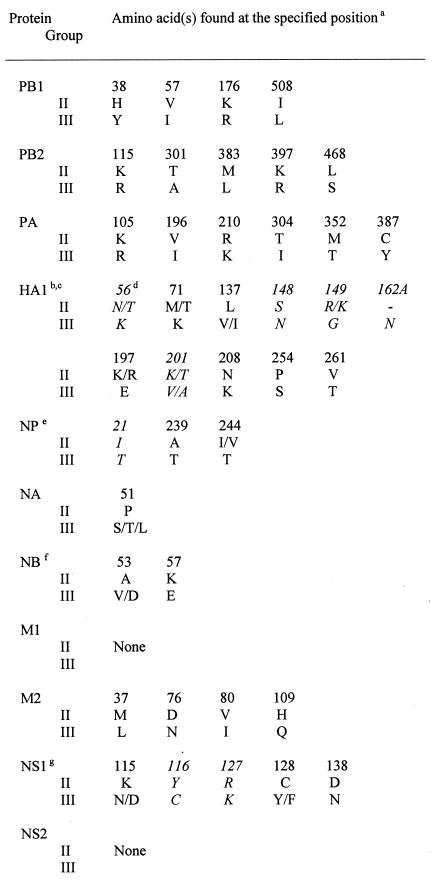
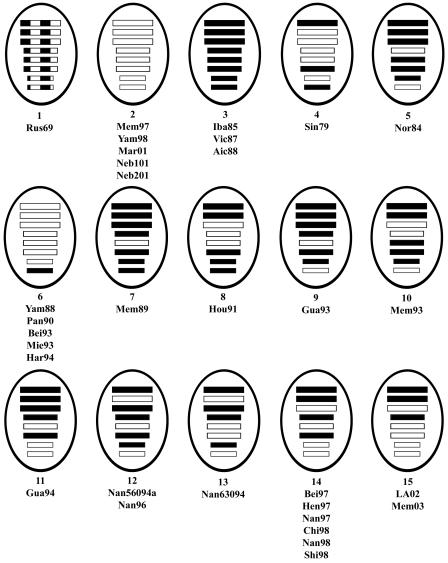
The segmented genome of influenza B virus allows exchange of gene segments between cocirculating strains. Through this process of reassortment, diversity is generated by the mixing of genes between viruses that differ in one or more gene segments. Phylogenetic and evolutionary analyses of all 11 genes of 31 influenza B viruses isolated from 1979 to 2003 were used to study the evolution of whole genomes. All 11 genes diverged into two new lineages prior to 1987. All genes except the NS1 gene were undergoing linear evolution, although the rate of evolution and the degree to which nucleotide changes translated into amino acid changes varied between lineages and by gene. Frequent reassortment generated 14 different genotypes distinct from the gene constellation of viruses circulating prior to 1979. Multiple genotypes cocirculated in some locations, and a sequence of reassortment events over time could not be established. The surprising diversity of the viruses, unrestricted mixing of lineages, and lack of evidence for coevolution of gene segments do not support the hypothesis that the reassortment process is driven by selection for functional differences.


Figures

FIG. 1.
FIG. 1.
Phylogenetic trees constructed using the neighbor-joining method and bootstrap analysis (n = 500) to determine the best-fitting tree for the PB1 and PB2 genes. Nucleotide distances were estimated by the method described by Tajima and Nei (29) and by using evolutionary trees drawn with TREECON software. The bar indicates a 2% difference at the nucleotide level.
FIG. 2.
FIG. 2.
Phylogenetic trees constructed using the neighbor-joining method and bootstrap analysis (n = 500) to determine the best-fitting tree for the PA and NP genes.
FIG. 3.
FIG. 3.
Phylogenetic tree constructed using the neighbor-joining method and bootstrap analysis (n = 500) to determine the best-fitting tree for the HA1 region of the HA gene.
FIG. 4.
FIG. 4.
Phylogenetic trees constructed using the neighbor-joining method and bootstrap analysis (n = 500) to determine the best-fitting tree for the NA and NB genes.
FIG. 5.
FIG. 5.
Phylogenetic trees constructed using the neighbor-joining method and bootstrap analysis (n = 500) to determine the best-fitting tree for the M1 and M2 genes.
FIG. 6.
FIG. 6.
Phylogenetic trees constructed using the neighbor-joining method and bootstrap analysis (n = 500) to determine the best-fitting tree for the NS1 and NS2 genes.
FIG. 7.
FIG. 7.
Amino acids specific for group 2 or group 3 lineages. a, numbering of amino acids is relative to B/Lee/40 beginning at the start of the coding region of each protein. b, differences were determined for the entire coding sequence of all proteins except HA, where only the region coding for HA1 was used (analysis of the limited number of full-length HA sequences available indicates that no lineage-specific differences are seen in the HA2 region). c, group 2 HA1 sequences in the ISD may also have a D, A, or K at position 56; a T at position 71; an N at position 148; a G at position 149; an N, R, or A at position 201; an S or D at position 208; or an I at position 261. Group 3 HA1 sequences may also have had a K at position 56 or an S, D, or no amino acid at position 162A. d, amino acids in italics are lineage specific within the viruses studied in this report, but exceptions exist within sequences found in the ISD, as further detailed here. For this determination, 30 post-1986 sequences each were examined for PB1, PB2, and PA; 722 sequences were examined for HA; 36 sequences were examined for NP; 119 sequences were examined for NA and NB; 36 sequences were examined for M1 and M2; and 80 sequences were examined for NS1 and NS2. e, group 2 NP sequences in the ISD may also have a T at position 21. f, group 2 NB sequences in the ISD may also have a T at position 53. g, group 2 NS1 sequences in the ISD may also have a C at position 116 or a K at position 127. -, no amino acid.
FIG. 8.
FIG. 8.
Genotypes of influenza B viruses. Hatched boxes represent lineage I genes, open boxes represent lineage II genes, and filled boxes represent lineage III genes. From top to bottom, the boxes within each virus diagram represent the lineage of gene segments 1 through 8, which code for PB1, PB2, PA, HA, NP, NA and NB, M1 and M2, and NS1 and NS2.

References

    1. Air, G. M., A. J. Gibbs, W. G. Laver, and R. G. Webster. 1990. Evolutionary changes in influenza B are not primarily governed by antibody selection. Proc. Natl. Acad. Sci. USA 87:3884-3888. - PMC - PubMed
    1. Air, G. M., W. G. Laver, M. Luo, S. J. Stray, G. Legrone, and R. G. Webster. 1990. Antigenic, sequence, and crystal variation in influenza B neuraminidase. Virology 177:578-587. - PubMed
    1. Akoto-Amanfu, E., N. Sivasubramanian, and D. P. Nayak. 1987. Primary structure of the polymerase acidic (PA) gene of an influenza B virus (B/Sing/222/79). Virology 159:147-153. - PubMed
    1. Barr, I. G., N. Komadina, A. Hurt, R. Shaw, C. Durrant, P. Iannello, C. Tomasov, H. Sjogren, and A. W. Hampson. 2003. Reassortants in recent human influenza A and B isolates from South East Asia and Oceania. Virus Res. 98:35-44. - PubMed
    1. Burmeister, W. P., F. Baudin, S. Cusack, and R. W. Ruigrok. 1993. Comparison of structure and sequence of influenza B/Yamagata and B/Beijing neuraminidases shows a conserved “head” but much greater variability in the “stalk” and NB protein. Virology 192:683-686. - PubMed

Publication types

LinkOut - more resources