. 2004 Dec;24(23):10340-51.
doi: 10.1128/MCB.24.23.10340-10351.2004.

Ternary complex factor-serum response factor complex-regulated gene activity is required for cellular proliferation and inhibition of apoptotic cell death

Affiliations

Ternary complex factor-serum response factor complex-regulated gene activity is required for cellular proliferation and inhibition of apoptotic cell death

Elaine R Vickers et al. Mol Cell Biol. 2004 Dec.

Abstract

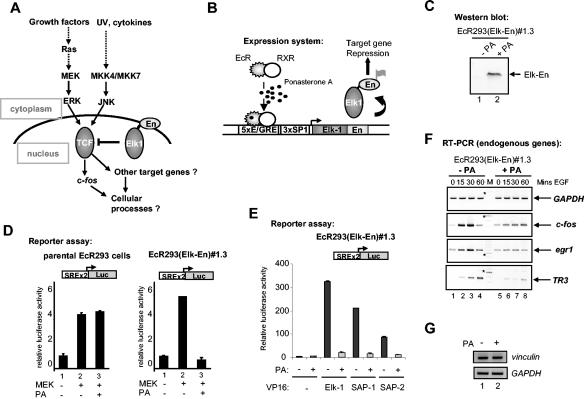
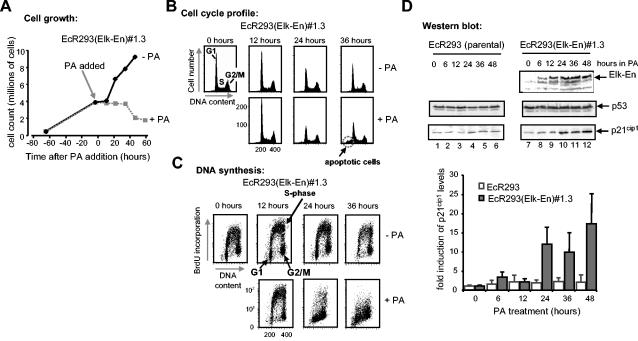
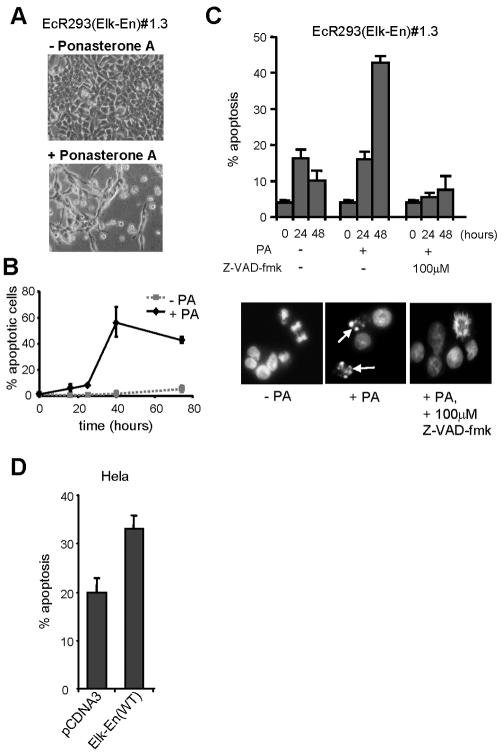
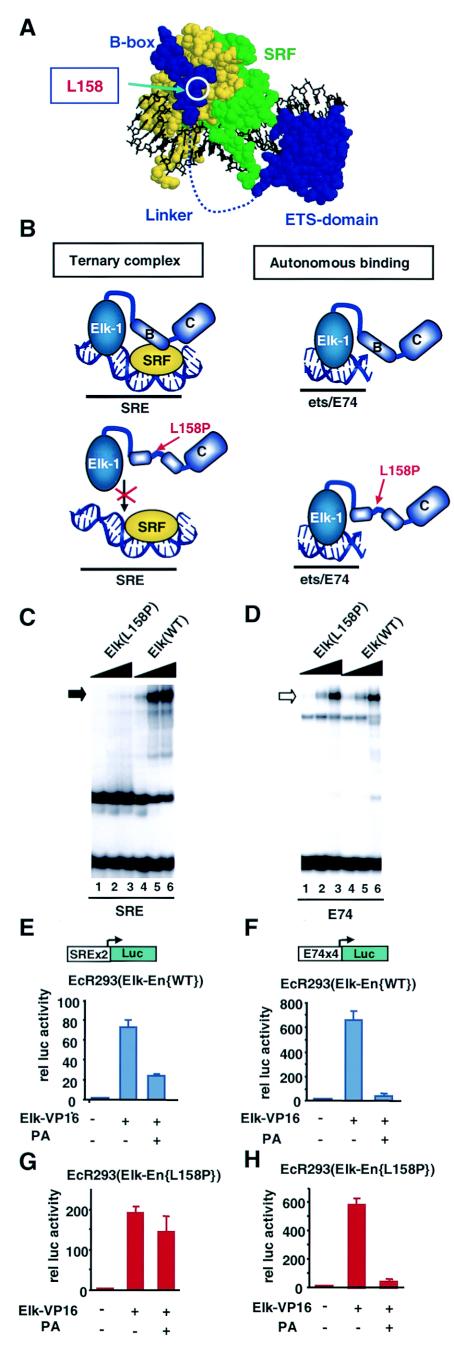
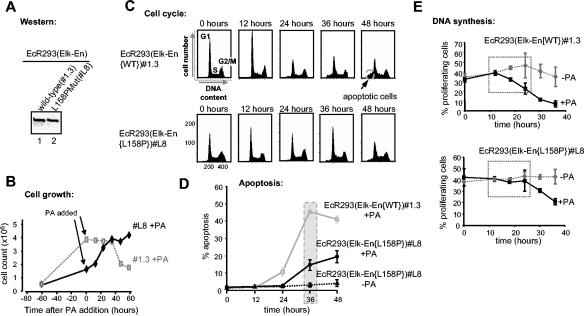
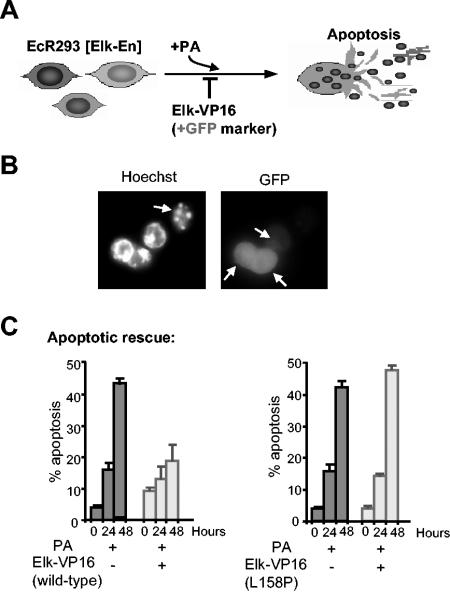
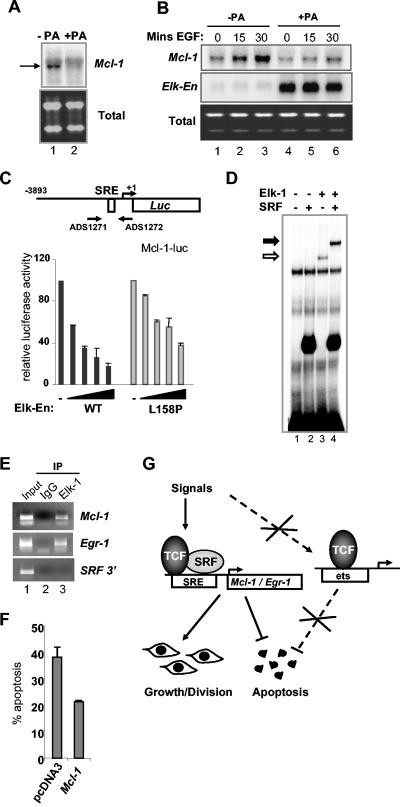
Members of the ternary complex factor (TCF) subfamily of the ETS-domain transcription factors are activated through phosphorylation by mitogen-activated protein kinases (MAPKs) in response to a variety of mitogenic and stress stimuli. The TCFs bind and activate serum response elements (SREs) in the promoters of target genes in a ternary complex with a second transcription factor, serum response factor (SRF). The association of TCFs with SREs within immediate-early gene promoters is suggestive of a role for the ternary TCF-SRF complex in promoting cell cycle entry and proliferation in response to mitogenic signaling. Here we have investigated the downstream gene regulatory and phenotypic effects of inhibiting the activity of genes regulated by TCFs by expressing a dominantly acting repressive form of the TCF, Elk-1. Inhibition of ternary complex activity leads to the downregulation of several immediate-early genes. Furthermore, blocking TCF-mediated gene expression leads to growth arrest and triggers apoptosis. By using mutant Elk-1 alleles, we demonstrated that these effects are via an SRF-dependent mechanism. The antiapoptotic gene Mcl-1 is identified as a key target for the TCF-SRF complex in this system. Thus, our data confirm a role for TCF-SRF-regulated gene activity in regulating proliferation and provide further evidence to indicate a role in protecting cells from apoptotic cell death.


Figures

FIG. 1.
FIG. 1.
Induction of Elk-En represses SRE-dependent gene regulation. (A) Schematic indicating the role of the TCFs as modulators of transcriptional effects in response to signals from MAPK pathways. Elk-En fusion proteins block signaling through Elk-1 to downstream target genes. En represents the En repression domain. (B) The PA-inducible expression system contained in EcR293(Elk-En) cell lines. EcR and RXR represent the ecdysone and retinoid X receptors that, upon binding to PA, activate the expression of Elk-En. Elk-En contains a C-terminal FLAG tag. (C) Western blot of FLAG-tagged Elk-En in EcR293(Elk-En)#1.3 cells before and after PA treatment for 24 h. (D) Repression of SRE-Luc reporter genes in response to PA-induction of Elk-En in EcR293(Elk-En)#1.3 cells. Parental EcR293 or EcR293(Elk-En)#1.3 cells were transfected with SRE-luciferase reporter constructs (0.25 μg) in the presence or absence of a vector encoding constitutively active MEK (0.5 μg) where indicated. Cells were incubated for 24 h in 10% FBS in the presence or absence of 5 μM PA. Data are presented as means and standard deviations (n = 3) normalized for β-galactosidase activity from a cotransfected pCH110 reporter construct. (E) Reporter gene analysis using SRE-Luc reporter in EcR293(Elk-En)#1.3 cells. Where indicated, plasmids encoding 0.5 μg of Elk-1, SAP-1, or SAP-2-VP16 fusions were transiently transfected to activate the reporters. Elk-En expression was induced by adding 5 μM PA. (F) Repression of EGFP induction of endogenous TCF target genes by Elk-En following PA induction in EcR293(Elk-En)#1.3 cells. Cells were synchronized by incubation in 0.05% FBS for 48 h; where indicated, 5 μM PA was added for the final 12 h. Cells were then stimulated with 50 nM EGFP, and the expression of GAPDH, c-fos, egr-1, and TR3 was analyzed by RT-PCR at the indicated times. For clarity, the color on the original image has been inverted. The asterisks indicate the locations of the 600-bp bands in the marker (M) lane. (G) RT-PCR analysis of the SRF-regulated gene vinculin. EcR293(Elk-En)#1.3 cells were serum starved for 24 h and incubated with PA for 7 h (where indicated) before stimulation with 10% serum for 1 h. GAPDH is shown as a control.
FIG. 2.
FIG. 2.
Induction of Elk-En causes growth arrest. (A) PA induction of Elk-En stops cell growth in EcR293(Elk-En) cells. EcR293(Elk-En)#1.3 cells were grown for 65 h to 30% confluency in 10% FBS and then treated with 5 μM PA for the indicated times. Cells remaining on the plate were trypsinized and were counted at the indicated times (averages of three counts are shown). (B and C) Cell cycle profile (B) and proliferation status (C) of EcR293(Elk-En)#1.3 cells in response to Elk-En induction. EcR293(Elk-En)#1.3 cells were grown for 24 h and then for the indicated times in the presence or absence of 5 μM PA. At the indicated time points, cells were harvested and the DNA content of the cells was determined by propidium iodide staining and FACS analysis (both axes represent linear scales) (B). Prior to harvesting, cells were incubated with BrdU for 1 h and the BrdU-dependent fluorescence was analyzed following FITC anti-BrdU staining. BrdU fluorescence was plotted on the y axis (logarithmic scale), with propidium iodide stain (DNA content) plotted on the x axis (linear scale) (C). Data are representative of two independent experiments. (D) Elk-En expression leads to induction of p21cip1 expression. EcR293 and EcR293(Elk-En)#1.3 cells were incubated in 10% FBS for 36 h, and 5 μM PA was added to the culture medium for a further 0 to 48 h. At the times indicated, extracts were assayed by Western blotting for the presence of Elk-En (top panel), p53 (middle panels), and p21cip1 (bottom panels). All blots are representative of at least two separate experiments. Data from the p21cip1 blots are shown quantitatively below each panel. Results plotted represent means plus standard deviations of severalfold enhancement compared to unstimulated-cell results for each cell line (data are averages of three separate experiments).
FIG. 3.
FIG. 3.
Induction of Elk-En induces apoptosis. (A) EcR293(Elk-En)#1.3 cell results following incubation in 10% FBS for 36 h in the presence or absence of 5 μM PA. (B) EcR293(Elk-En)#1.3 cells were incubated in 10% FBS in the presence or absence of 5 μM PA, and samples were taken for Hoechst staining at the indicated times. Cells (3 × 100) were examined microscopically for healthy or apoptotic nuclei, and the percentage of apoptotic cells was calculated. Means ± standard deviations are plotted. (C) EcR293(Elk-En)#1.3 cells were treated and analyzed as described for panel B except that in one case, the caspase inhibitor Z-VAD-fmk (100 μM) was added at the same time as PA. Data shown are the averages of three cell counts taken from each of two separate slides and are representative of two individual experiments. Representative pictures of cells left untreated, those treated for 48 h with PA, and those treated with Z-VAD-fmk are shown. Apoptotic nuclei are indicated with arrows. (D) Elk-En stimulates apoptosis in HeLa cells. HeLa cells were cotransfected with GFP and Elk-En expression plasmids, and the percentage of apoptotic cells was counted following Hoechst staining. HeLa cells transfected with empty pCDNA3 vector are shown as a control. Data are representative of four independent experiments.
FIG.4.
FIG.4.
Elk-En(L158P) mutant is defective in SRE-mediated repression. (A) Structure of the ternary SAP-1-SRF complex (19). SRF monomers are shown in green and yellow, and SAP-1 is shown in blue. The locations of the ETS-domain, linker, B-box region, and the residue corresponding to L158 in Elk-1 are indicated. (B) Diagrammatic representation of ternary Elk-1-SRF-SRE and binary Elk-1ets/E74 complexes in presence of wild-type and L158P mutant Elk-1. Regions corresponding to the B-box (indicated by the letter B) and C-terminal region (indicated by the letter C) are shown. (C and D) Gel retardation analysis of wild-type and L158P mutant Elk-En on the SRE (C) and E74 (D) sites. Increasing amounts of each in vitro-translated protein are included in each set of lanes (ratios: 1 [lanes 1 and 4], 3 [lanes 2 and 5], and 10 [lanes 3 and 6]). (E to H) Reporter gene analysis using SRE-Luc (E and G) and E74-Luc (F and H) reporters in EcR293 lines that inducibly express Elk-En(WT) [#1.3] (E and F) or Elk-En(L158P) [#L8] (G and H). Where indicated, 0.5 μg of Elk-VP16 was transiently transfected to activate the reporters. Elk-En expression is induced by adding 5 μM PA.
FIG. 5.
FIG. 5.
EcR393 cells expressing the Elk-En(L158P) mutant exhibit reduced growth arrest and apoptotic induction. (A) Western blot analysis of wild-type Elk-En and the Elk-En(L158P) following PA induction for 24 h in the EcR293-Elk-En cell lines #1.3 and L8, respectively. (B) PA induction of Elk-En does not stop cell growth in EcR293(Elk-En{L158P}) cells. EcR293(Elk-En{L158P})#L8 cells were grown and treated with PA as described for Fig. 2A. The data from the EcR293(Elk-En)#1.3 cell line results shown for Fig. 2A are shown in the background for comparison. (C) Cell cycle profile of EcR293(Elk-En{L158P})#L8 cells in response to Elk-En induction. EcR293(Elk-En{WT})#1.3 and EcR293(Elk-En{L158P})L8 cells were grown and treated with PA and analyzed by FACS as described for Fig. 2B. The apoptotic sub-G1 peak is highlighted. (D) Reduced levels of apoptotic cell death occur in EcR293-Elk-En(L158P)#L8 cells. Apoptotic cells were visualized by Hoechst staining following treatment of EcR293(Elk-En{WT})#1.3 and EcR293(Elk-En{L158P})L8 cells with PA as described for Fig. 3B. (E) The percentage of EcR293(Elk-En{WT})#1.3 and EcR293(Elk-En{L158P})L8 cells undergoing DNA synthesis following PA induction of Elk-En was analyzed by studying BrdU incorporation by FACS analysis (Fig. 2C). Results shown represent the averages for two dishes for each time point and are representative of at least two separate experiments. The dotted boxes highlight the differences during early time points between untreated and PA-treated cells.
FIG. 6.
FIG. 6.
Elk-VP16 rescues cells from death induced by Elk-En. (A) Schematic of the experimental protocol. +GFP, EGFP. (B and C) Rescue of apoptosis by transfection of Elk-VP16 following induction of Elk-En with PA. EcR293(Elk-En)#1.3 cells were transfected with plasmids encoding EGFP (200 ng) and, where indicated, Elk-VP16 or Elk-VP16(L158P) (50 ng). At 24 h posttransfection (time 0), 5 μM PA was added where specified. Cells were analyzed by Hoechst staining at the indicated time points. Slides were examined for transfection efficiency by observing green fluorescing cells and for percentages of apoptosis by observing nuclear morphology. (B) Representative pictures are shown for cells transfected with 50 ng of Elk-VP16 and incubated with 5 μM PA for 48 h. The left panel shows Hoechst staining; the right panel shows GFP fluorescence. Arrows indicate apoptotic cells (Hoechst staining) and GFP-expressing cells (GFP fluorescence). (C) Data shown are the averages of three cell counts (percentages of total cell population) taken from each of two separate slides.
FIG. 7.
FIG. 7.
Mcl-1 is an antiapoptotic Elk-1 target gene. (A and B) Northern blot analysis of Mcl-1 expression in serum-starved EcR293(Elk-En)#1.3 cells in the presence and absence of treatment with 5 μM PA for 18 h (A) or 2.5 h (B). (B) Cells were stimulated with EGFP for the indicated times. Lower panels show total mRNA. (C) Mcl-1 promoter analysis. 293 cells were transiently transfected with a luciferase construct containing the Mcl-1 promoter and with increasing concentrations of Elk-En(WT) and Elk-En(L158P) (0, 1, 5, 10, 25 ng for each of the WT and L158P bars from left to right, respectively). Luciferase activity was measured 24 h after transfection. The results were normalized to β-galactosidase activity. (D) Gel retardation assay with a fragment of Mcl-1 promoter (−79 to −127). The DNA was incubated with the indicated combinations of purified coreSRF and full-length Elk-1 in the presence of unprogrammed rabbit reticulocyte lysate. Binary and ternary complexes containing Elk-1 are shown by open and closed arrows, respectively. (E) Chromatin IP of Elk-1 bound to the Mcl-1 and Egr-1 promoters. HeLa cells were starved in serum-free DMEM for 48 h and then stimulated with 10 nM PMA for 15 min. Sonicated chromatin was immunoprecipitated with either anti-Elk-1antibody or nonspecific IgG. PCR analysis of eluted DNA was performed using oligonucleotides specific for Mcl-1 and Egr-1 promoters and an SRF intronic sequence. Lane 1, 2% of input DNA. (F) EcR293(Elk-En) cells were transfected with 1.5 μg of a CMV-driven Mcl-1 expression vector or with pCDNA3. At 24 h after transfection, the cells were stimulated with 5 μM PA. At 48 h later, cells were subjected to Hoechst staining and apoptotic cells were counted. Data are representative of two independent experiments. (G) Model showing that ternary TCF-SRF complex-specific gene expression is required to promote cellular proliferation and inhibit cell death. Genes such as Mcl-1 that are regulated by the ternary TCF-SRF-SRE complex must be active to permit cell growth and division and to inhibit apoptotic cell death. Blocking the activity of this complex with Elk-En causes cell cycle arrest and apoptotic cell death. Experiments using mutant forms of Elk-En (L158P) demonstrated that the major route of action is not via binary TCF-DNA complexes.

Similar articles

Cited by

References

    1. Alexandropoulos, K., S. A. Qureshi, M. Rim, V. P. Sukhatme, and D. A. Foster. 1992. v-Fps-responsiveness in the Egr-1 promoter is mediated by serum response elements. Nucleic Acids Res. 20:2355-2359. - PMC - PubMed
    1. Ayadi, A., H. Zheng, P. Sobieszczuk, G. Buchwalter, P. Moerman, K. Alitalo, and B. Wasylyk. 2001. Net-targeted mutant mice develop a vascular phenotype and up-regulate egr-1. EMBO J. 20:5139-5152. - PMC - PubMed
    1. Badiani, P., P. Corbella, D. Kioussis, J. Marvel, and K. Weston. 1994. Dominant interfering alleles define a role for c-Myb in T-cell development. Genes Dev. 8:770-782. - PubMed
    1. Bertolotto, C., J. E. Ricci, F. Luciano, B. Mari, J. C. Chambard, and P. Auberger. 2000. Cleavage of the serum response factor during death receptor-induced apoptosis results in an inhibition of the c-FOS promoter transcriptional activity. J. Biol. Chem. 275:12941-12947. - PubMed
    1. Cesari, F., S. Brecht, K. Vintersten, L. G. Vuong, M. Hofmann, K. Klingel, J. J. Schnorr, S. Arsenian, H. Schild, T. Herdegen, F. F. Wiebel, and A. Nordheim. 2004. Mice deficient for the Ets transcription factor Elk-1 show normal immune responses and mildly impaired neuronal gene activation. Mol. Cell. Biol. 24:294-305. - PMC - PubMed

Publication types

MeSH terms

LinkOut - more resources