. 2004 Dec;24(23):10406-15.
doi: 10.1128/MCB.24.23.10406-10415.2004.

Genetic interaction between Rb and K-ras in the control of differentiation and tumor suppression

Affiliations

Genetic interaction between Rb and K-ras in the control of differentiation and tumor suppression

Chiaki Takahashi et al. Mol Cell Biol. 2004 Dec.

Abstract

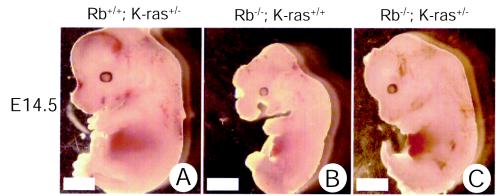
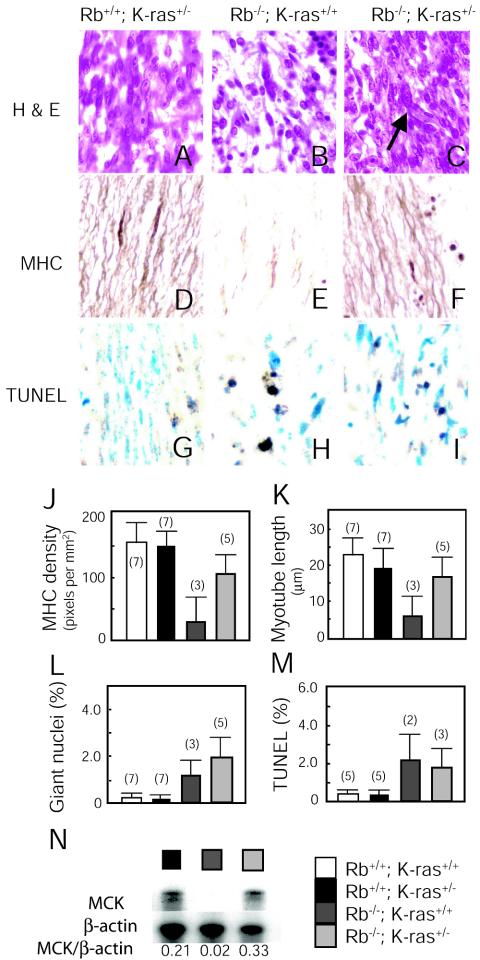
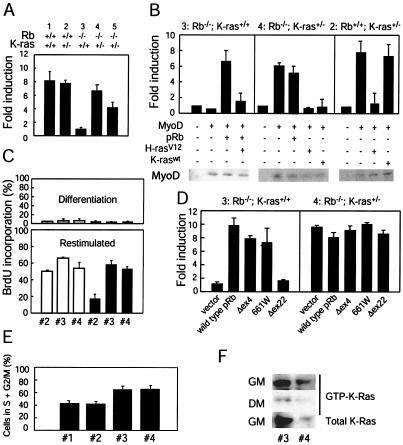
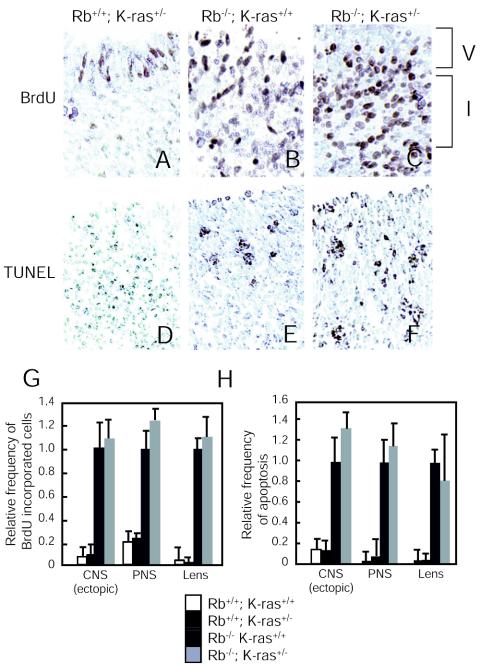
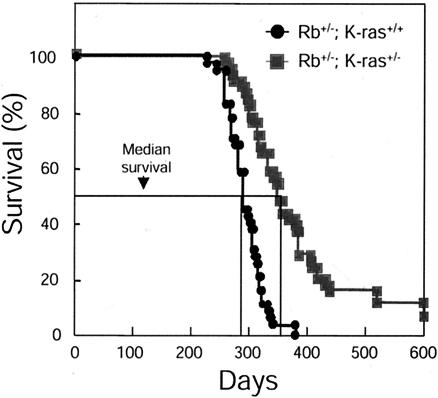
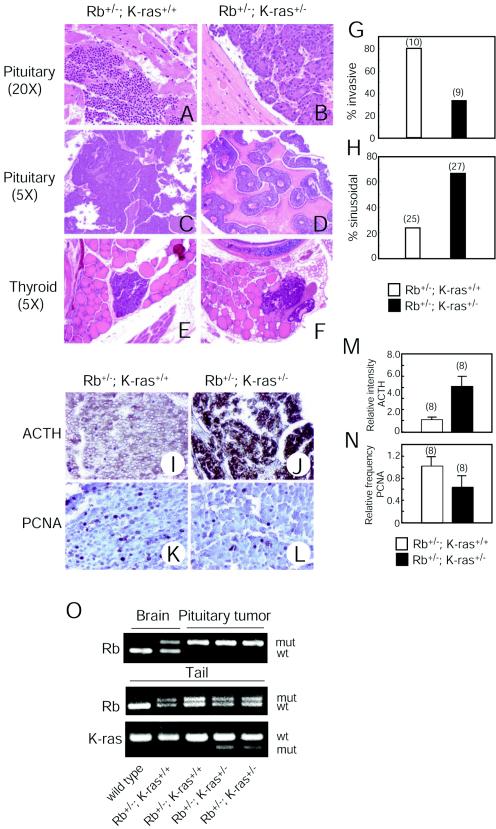
Although the retinoblastoma protein (pRb) has been implicated in the processes of cellular differentiation, there is no compelling genetic or in vivo evidence that such activities contribute to pRb-mediated tumor suppression. Motivated by cell culture studies suggesting that Ras is a downstream effector of pRb in the control of differentiation, we have examined the tumor and developmental phenotypes of Rb and K-ras double-knockout mice. We find that heterozygosity for K-ras (i) rescued a unique subset of developmental defects that characterize Rb-deficient embryos by affecting differentiation but not proliferation and (ii) significantly enhanced the degree of differentiation of pituitary adenocarcinomas arising in Rb heterozygotes, leading to their prolonged survival. These observations suggest that Rb and K-ras function together in vivo, in the contexts of both embryonic and tumor development, and that the ability to affect differentiation is a major facet of the tumor suppressor function of pRb.


Figures

FIG. 1.
FIG. 1.
Effects of heterozygous loss of K-ras on the appearance of Rb-deficient embryos. Live littermate embryos with the indicated genotypes were recovered at E14.5 and immediately photographed in saline. Bars, 1.0 mm.
FIG. 2.
FIG. 2.
Effects of heterozygous loss of K-ras on skeletal muscle development in E14.5 Rb-deficient embryos. (A to F) Longitudinal sections through the fibers of thoracic somite-associated skeletal muscles from sagittal sections of live E14.5 embryos derived from the same litter with the indicated genotypes were stained with H&E (A to C) or immunostained with an antibody to MHC (D to F). A large nucleus (arrow) in myotubes is indicated in panel C. Magnification, ×40. (G to I) Apoptosis (TUNEL) observed in myoblasts of thoracic skeletal muscles of live E14.5 embryos of the indicated genotypes. Magnification, ×40. (J) Density of MHC staining in myotubes. Ten myotubes per embryo were analyzed; average densities of the MHC signal ± standard errors are shown. Numbers of embryos analyzed are given in parentheses. (K) The lengths of myotubes immunostained with an antibody to MHC were quantified. Longitudinal sections of thoracic skeletal muscles from live E14.5 embryos were analyzed by microscopic observation. Twenty myotubes per embryo were measured; average lengths ± standard errors are presented. Numbers of embryos analyzed are given in parentheses. (L) One hundred myotubes in the thoracic skeletal muscle were analyzed for the presence of giant nucleifollowing staining with H&E. Average percentages ± standard errors are presented. Numbers of embryos analyzed are given in parentheses. (M) The level of apoptosis was quantified by counting the frequency of TUNEL-positive cells per 300 nuclei analyzed in the thoracic muscle. Average percentages ± standard errors are presented. Numbers of embryos analyzed are given in parentheses. (N) Expression of MCK in live E14.5 littermates determined by RNase protection assays with RNAs derived from carcasses. Ratios of MCK to β-actin expression are given below the autoradiograph.
FIG. 3.
FIG. 3.
Effects of K-ras heterozygosity on MyoD transcriptional activity in Rb-deficient myoblasts. (A) MEFs of the indicated genotypes were transfected with an MCK promoter reporter construct (MCK-luc; 0.25 μg), pCSA-MyoD (1.25 μg), and pCMV-β-gal (0.25 μg). Twenty-four hours later, the cells were placed in differentiation medium for 48 h. Luciferase and β-galactosidase activities were determined, and normalized fold activations were calculated relative to the corrected luciferase activity in the absence of MyoD. Results are means ± standard errors for three independent experiments performed in triplicate. Numbers above the bar graph represent the particular MEFs used; groups 1 and 5 are derived from matched littermates, as are groups 2, 3, and 4. (B) MEFs 3, 4, and 2 were transfected as described for panel A. Plasmids encoding pRb (0.25 μg), H-rasV12 (0.5 μg), and K-raswt (0.5 μg) were included in the transfections as indicated. Fold activations were calculated relative to the corrected luciferase activity in the absence of MyoD. Results are means ± standard errors for three independent experiments performed in triplicate. Immunoblots for ectopically expressed MyoD are shown. (C) MEFs 2, 3, and 4 (designations as described for panel A) were infected with a retrovirus encoding MyoD (filled bars) or empty vector (open bars) and cultured under differentiation conditions for 72 h. Subsequently, cells were either further cultured in differentiation medium or restimulated with 20% FBS in the presence of BrdU for 24 h. Percentages of cells incorporating BrdU under differentiation conditions (upper panel) and following restimulation (lower panel) were determined. Results are means ± standard errors for two independent experiments. (D) MEFs 3 and 4 were transfected as described for panel A. A plasmid (0.25 μg) encoding pRb, pRb(661W), pRb(Δex4), or pRb(Δex22), or a vector control, was included in the transfection as indicated. Cells were treated as described for panel A, and fold activations were calculated relative to the corrected luciferase activity in the absence of MyoD. Results are means ± standard errors from three independent experiments performed in duplicate. (E) The cell cycle distribution of asynchronous cultures of MEFs 1, 2, 3, and 4 (designations as described for panel A) was determined by fluorescence-activated cell sorting. Results are means ± standard errors for percentages of cells in S and G2/M from four independent experiments. (F) MEFs 3 and 4 (designations as described for panel A) were cultured in 2% horse serum (differentiation medium [DM]) for 72 h. At this time, the level of activated, GTP-bound K-Ras was determined (middle panel). Alternatively, cells cultured in the presence of horse serum (low levels of mitogens) were restimulated with 20% fetal bovine serum (growth medium [GM]) for 6 h; at this time, the level of active K-Ras wasdetermined (top panel). Whole-cell lysates were analyzed for total K-Ras protein levels (bottom panel). Results are representative of three independent experiments.
FIG. 4.
FIG. 4.
Effects of heterozygous K-ras loss on ectopic S-phase entry and cell death. (A-C) Transverse sections of the ventricular (V) and intermediate (I) zones of the hindbrain in the CNS from E13.5 embryos of the indicated genotypes were stained for cells in S phase (BrdU). Magnification, ×20. (D-F) Midsagittal sections of the cortical region around the fourth ventricle from E13.5 embryos of the indicated genotypes were stained for apoptotic cells (TUNEL). Magnification, ×20. (G) The level of ectopic S-phase entry was quantified by counting the frequency of BrdU-positive cells per unit area in tissue sections of the intermediate zone of the hindbrain (CNS [ectopic]), dorsal root ganglia (PNS), and fiber compartment of the lens (Lens). Total cell numbers were determined by counting cells counterstained with methyl blue. Rb/ samples were set to 1.0, and the relative ratios of BrdU-positive cells are displayed. Values are means ± standard errors for two to four embryos. (H) The level of apoptosis was quantified by counting the frequency of TUNEL-positive cells per unit area of tissues: the cortical region around the fourth ventricle of the CNS, the dorsal root ganglia of the PNS, and the fiber compartment of the lens. Total cell numbers were determined by counting cells counterstained with methyl blue. Rb/ samples were set to 1.0, and the relative ratios of TUNEL-positive cells are displayed. Values are means ± standard errors for two to four embryos.
FIG. 5.
FIG. 5.
Effects of K-ras heterozygosity on the survival of Rb+/ mice. Progeny arising from Rb+/ × K-ras+/ intercrosses were aged together. Shown are survival curves for Rb+/ K-ras+/+ (n = 44) and Rb+/ K-ras+/ (n = 48) mice. Percent survival represents the percentage of the initial starting population surviving at a given age (in days) for the indicated genotype. Median survival is indicated.
FIG. 6.
FIG. 6.
Effects of K-ras heterozygosity on characteristics of tumors arising in Rb+/ mice. (A-D) H&E-stained sections of pituitary adenocarcinomas from mice of the indicated genotypes. Magnifications, ×18 (A and B) and ×4.5 (C and D). Original magnifications are given in parentheses. (E and F) H&E-stained sections of C-cell adenomas from mice of the indicated genotypes. Magnification, ×4.5. Original magnification is given in parentheses. (G) Frequency of appearance of invasive tumors. Genotypes and numbers of mice analyzed are given. (H) Frequencyof appearance of sinusoidal (versus diffuse) pattern of growth. Genotypes and numbers of mice analyzed are given. (I and J) Anti-ACTH immunostaining of pituitary tumors arising in mice of the indicated genotypes. Magnification, ×18. (K and L) Anti-PCNA immunostaining of pituitary tumors arising in mice of the indicated genotypes. Magnification, ×36. (M) Quantification of ACTH immunostaining. Genotypes and numbers of mice analyzed are given. Bars represent means ± standard errors. (N) Quantification of PCNA immunostaining. Genotypes and numbers of mice analyzed are given. Bars represent means ± standard errors. (O) Genotyping of Rb and K-ras in normal brain tissue, pituitary tumors, and tails from mice of the indicated genotypes by PCR. The weak band for the wild-type Rb allele that appeared in one of the pituitary tumors is likely derived from nontumor cells residing in tumors. wt, wild type; mut, mutant.

Similar articles

Cited by

References

    1. Capen, C. C., E. Karbe, U. Deschl, C. George, P.-G. Germann, C. Gopinath, J. F. Hardisty, J. Kanno, W. Kaufmann, G. Krinke, K. Kuttler, B. Kulwich, C. Landes, B. Lenz, L. Longeart, I. Paulson, E. Sander, and K. Tuch. 2001. Endocrine system, p. 269-322. In U. Mohr (ed.), International classification of rodent tumors: the mouse. Springer-Verlag, Berlin, Germany.
    1. Charles, A., X. Tang, E. Crouch, J. S. Brody, and Z. X. Xiao. 2001. Retinoblastoma protein complexes with C/EBP proteins and activates C/EBP-mediated transcription. J. Cell. Biochem. 83:414-425. - PubMed
    1. Chen, P.-L., D. J. Riley, Y. Chen, and W.-H. Lee. 1996. Retinoblastoma protein positively regulates terminal adipocyte differentiation through direct interaction with C/EBPs. Genes Dev. 10:2794-2804. - PubMed
    1. Chen, P.-L., D. J. Riley, S. Chen-Kiang, and W.-H. Lee. 1996. Retinoblastoma protein directly interacts with and activates the transcription factor NF-IL6. Proc. Natl. Acad. Sci. USA 93:465-469. - PMC - PubMed
    1. Clarke, A. R., E. R. Maandag, M. van Roon, N. M. T. van der Lugt, M. van der Valk, M. L. Hooper, A. Berns, and H. te Riele. 1992. Requirement for a functional Rb-1 gene in murine development. Nature 359:328-330. - PubMed

Publication types

MeSH terms