Comparative Study
. 2004 Aug;126(4):523-8.
doi: 10.1115/1.1785811.

Measurement of strain in physical models of brain injury: a method based on HARP analysis of tagged magnetic resonance images (MRI)

Affiliations
Comparative Study

Measurement of strain in physical models of brain injury: a method based on HARP analysis of tagged magnetic resonance images (MRI)

P V Bayly et al. J Biomech Eng. 2004 Aug.

Abstract

Two-dimensional (2-D) strain fields were estimated non-invasively in two simple experimental models of closed-head brain injury. In the first experimental model, shear deformation of a gel was induced by angular acceleration of its spherical container In the second model the brain of a euthanized rat pup was deformed by indentation of its skull. Tagged magnetic resonance images (MRI) were obtained by gated image acquisition during repeated motion. Harmonic phase (HARP) images corresponding to the spectral peaks of the original tagged MRI were obtained, following procedures proposed by Osman, McVeigh and Prince. Two methods of HARP strain analysis were applied, one based on the displacement of tag line intersections, and the other based on the gradient of harmonic phase. Strain analysis procedures were also validated on simulated images of deformed grids. Results show that it is possible to visualize deformation and to quantify strain efficiently in animal models of closed head injury.


Figures

Figure 1
Figure 1
Representative images and data analysis. A. SPAMM-tagged image in k-space. Yellow circle represents one filter used for extracting the harmonic peak. B. The corresponding magnitude image of the harmonic peak. C. The corresponding HARP image masked by myocardial contours. D. Synthetic tag lines generated from the isophase contours of π/2. E. Manually traced myocardial contours using B-spline method. F. SPAMM-tagged image overlaid with manually traced tag lines and intersecting tag points. G. Triangulation of the myocardium for homogeneous strain analysis. Each red dot represents the centroid of a triangle. H. Visualization of regional myocardial wall motion with the trajectories of the centroids from diastole to systole. Yellow, red, blue, and magenta colors represent lateral, inferior, septal, and anterior regions, respectively.
Figure 2
Figure 2
Schematic illustration of a material point in initial reference frame at time t=0 (q) and deformed frame at time t (y). F is the 2D deformation gradient tensor.
Figure 3
Figure 3
Validation of strain calculation with simulated images. A. Reference image. B. Deformed image by stretch strain in horizontal direction (Exx=0.345) without noise. C. Deformed image by shear strain (Exy=0.3) without noise. D. Deformed image by stretch strain in horizontal direction (Exx=0.345) with 50% noise. E. Deformed image by shear strain (Exy=0.3) with 50% noise. F. Correlations of calculated stretch strains without noise. G. Correlations of calculated shear strains without noise. H. Correlations of calculated stretch strains with noise ranging from 20% to 100%. I. Correlations of calculated shear strains with noise ranging from 20% to 100%.
Figure 4
Figure 4
Representative strain maps from an infarct heart (top panels) and a control heart (bottom panels) at apical level. Red color indicates stretch and blue color indicates shortening. The red arrow indicates infarct region. A and E. E1 maps by homogeneous analysis. B and F. E1 maps by HARP analysis. C and G. E2 maps by homogeneous analysis. D and H. E2 maps by HARP analysis.
Figure 5
Figure 5
Maximal stretch (A) and maximal shortening (B) assessed by homogeneous (white bars) and HARP analysis (gray bars) at apex, midventricle and base. *p<0.05 vs control, p<0.01 vs control.
Figure 6
Figure 6
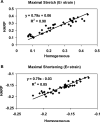
Correlations between myocardial strains as assessed by HARP (y-axis) and homogeneous method (x-axis) for maximal stretch (A) and maximal shortening (B).
Figure 7
Figure 7
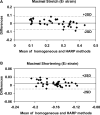
Bland-Alman plots for the comparison of myocardial maximal stretch (A) and maximal shortening (B).
Figure 8
Figure 8
Maximal stretch (A) and maximal shortening (B) assessed by homogeneous (white bars) and HARP analysis (gray bars) in segmented regions at apex. *p<0.05 vs control, p<0.01 vs control.
Figure 9
Figure 9
Correlations between segmented myocardial strains as assessed by HARP (y-axis) and homogeneous method (x-axis) for maximal stretch (A) and maximal shortening (B).

References

    1. Zerhouni EA, Parish DM, Rogers WJ, Yang A, Shapiro EP. Human heart: tagging with MR imaging--a method for noninvasive assessment of myocardial motion. Radiology. 1988;169:59–63. - PubMed
    1. Axel L, Dougherty L. Heart wall motion: improved method of spatial modulation of magnetization for MR imaging. Radiology. 1989;172:349–350. - PubMed
    1. Axel L, Dougherty L. MR imaging of motion with spatial modulation of magnetization. Radiology. 1989;171:841–845. - PubMed
    1. McVeigh ER, Zerhouni EA. Noninvasive measurement of transmural gradients in myocardial strain with MR imaging. Radiology. 1991;180:677–683. - PMC - PubMed
    1. Rademakers FE, Rogers WJ, Guier WH, Hutchins GM, Siu CO, Weisfeldt ML, Weiss JL, Shapiro EP. Relation of regional cross-fiber shortening to wall thickening in the intact heart. Three-dimensional strain analysis by NMR tagging. Circulation. 1994;89:1174–1182. - PubMed