. 2004 Dec;138(3):375-87.
doi: 10.1111/j.1365-2249.2004.02649.x.

Early up-regulation of Th2 cytokines and late surge of Th1 cytokines in an atopic dermatitis model

Affiliations

Early up-regulation of Th2 cytokines and late surge of Th1 cytokines in an atopic dermatitis model

L Chen et al. Clin Exp Immunol. 2004 Dec.

Abstract

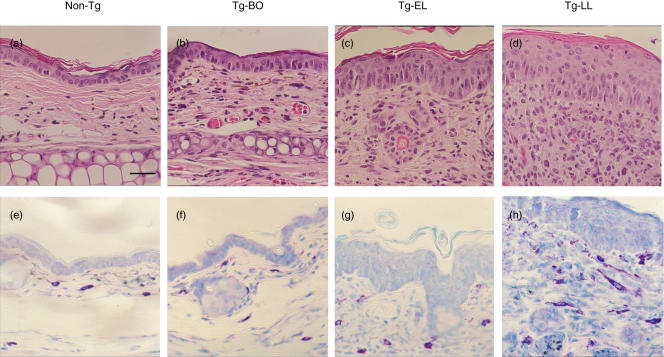
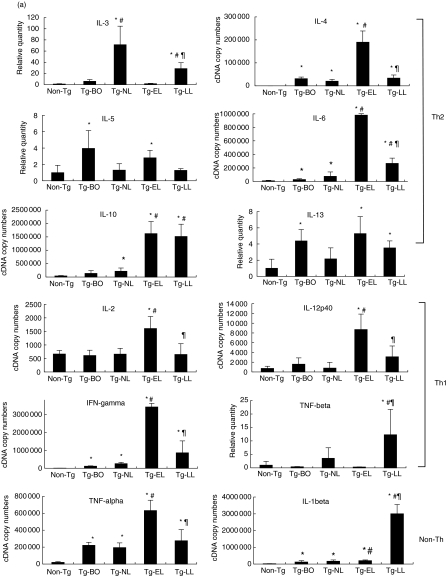
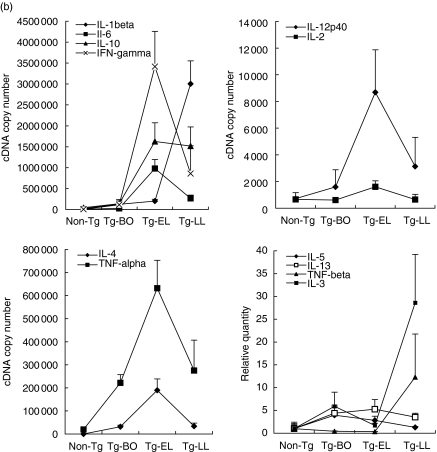
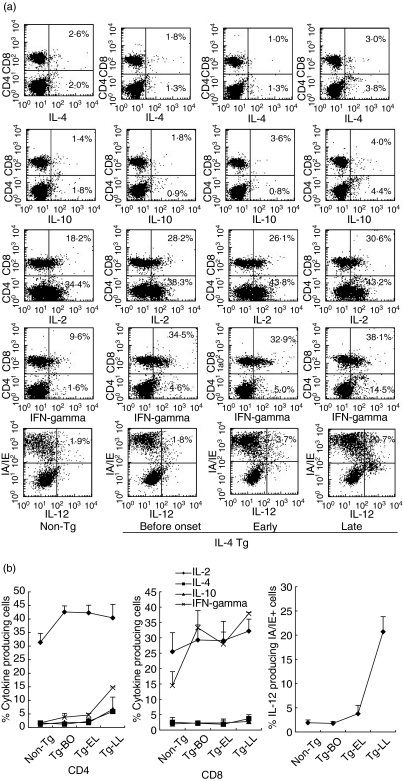
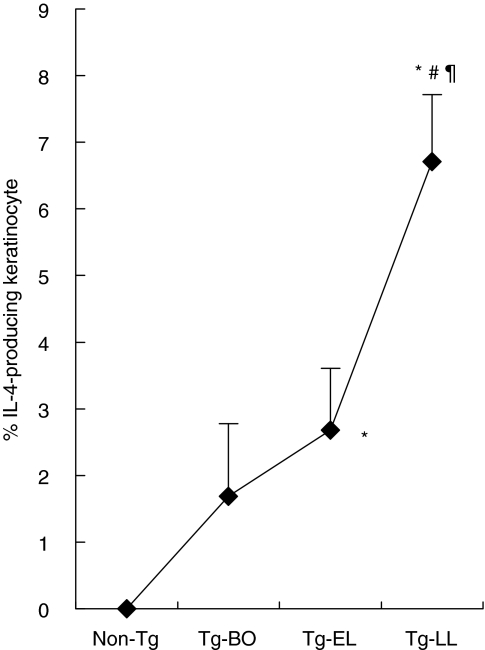
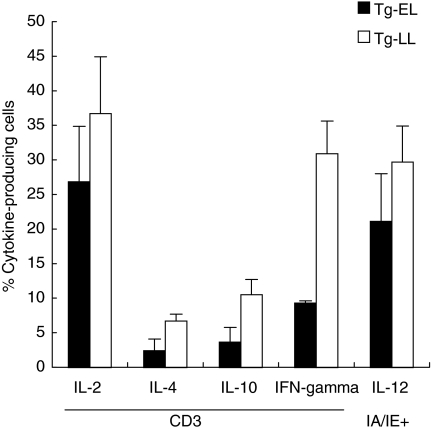
We investigated cytokine profiles in interleukin (IL)-4 transgenic (Tg) mice with a skin inflammatory disease resembling human atopic dermatitis. cDNA microarray revealed that the mRNAs encoding IL-1beta, IL-2, IL-3, IL-4, IL-5, IL-6, IL-10, IL-12p40, IL-13, tumour necrosis factor (TNF)-alpha, TNF-beta and interferon (IFN)-gamma were up-regulated in the skin of late lesion Tg mice and to a lesser degree in non-lesion Tg mice when compared to those of non-Tg mice. Real time reverse transcription-polymerase chain reaction (RT-PCR) analyses indicated that the cDNA copy numbers of IL-1beta, IL-4, IL-6, IL-10, TNF-alpha and IFN-gamma from the skin of late, early and non-lesions increased significantly compared to non-Tg mice. IL-2 and IL-12p40 cDNA copy numbers were increased significantly in early, but not late, lesions. Interestingly, IL-1beta, IL-3, IL-4, IL-5, IL-6, IL-10, IL-13, TNF-alpha, and IFN-gamma cDNAs were increased significantly the skin of before-onset and/or non-lesion mice. Flow cytometry analyses demonstrated an increased percentage of keratinocytes producing IL-4 as the disease progressed. The percentage of IL-2, IL-4, IL-10 and IFN-gamma-producing T cells and IL-12-producing antigen-presenting cells in skin-draining lymph nodes and inflammatory skin also increased, particularly in mice with late lesion. These results suggest that disease induction is primarily triggered by Th2 cytokines and that Th1, Th2 and non-Th proinflammatory cytokines are all involved in the disease process.


Figures

Fig. 1
Fig. 1
Histology of skin samples obtained from non-Tg mouse (a,e), K14-IL-4-Tg mouse before disease onset (b,f), early lesions (c,g) and late lesions (d,h) were stained with H&E (a–d) and Giemsa (e–h). Bar, 34 µm (a–h).
Fig. 2
Fig. 2
RT-real time PCR quantitative analysis of cytokine mRNA expression in the skin. Total RNAs were first extracted from non-Tg, Tg-BO, Tg-NL, Tg-EL and Tg-LL mice (n = 10 for each group), and were then reverse transcripted. For real time PCR, we used SYBR green mix with cytokine gene-specific primers (IL-1β, IL-2, IL-4, Il-6, IL-10, IL-12p40, IFN-γ and TNF-α) and cDNA template or 10-fold serial dilutions of the plasmid standards. For IL-3, IL-5, IL-13 and TNF-β, comparative quantification was performed and results were expressed in fold increase compared to non-Tg mice. Copy numbers of IL-1β, IL-2, IL-4, Il-6, IL-10, IL-12p40, IFN-γ and TNF-α and fold increase of IL-3, IL-5, IL-13 and TNF-β. Line graph of the cytokine expression at various stages of the disease. *Significant increase compared to non-Tg; ♯significant increase compared to Tg-BO; ¶significant difference between Tg-EL and Tg-LL.
Fig. 2
Fig. 2
RT-real time PCR quantitative analysis of cytokine mRNA expression in the skin. Total RNAs were first extracted from non-Tg, Tg-BO, Tg-NL, Tg-EL and Tg-LL mice (n = 10 for each group), and were then reverse transcripted. For real time PCR, we used SYBR green mix with cytokine gene-specific primers (IL-1β, IL-2, IL-4, Il-6, IL-10, IL-12p40, IFN-γ and TNF-α) and cDNA template or 10-fold serial dilutions of the plasmid standards. For IL-3, IL-5, IL-13 and TNF-β, comparative quantification was performed and results were expressed in fold increase compared to non-Tg mice. Copy numbers of IL-1β, IL-2, IL-4, Il-6, IL-10, IL-12p40, IFN-γ and TNF-α and fold increase of IL-3, IL-5, IL-13 and TNF-β. Line graph of the cytokine expression at various stages of the disease. *Significant increase compared to non-Tg; ♯significant increase compared to Tg-BO; ¶significant difference between Tg-EL and Tg-LL.
Fig. 3
Fig. 3
Intracellular IL-2, IL-4, IL-10 and IFN-γ expression in CD4+ and CD8+ cells and IL-12 expression in IA-IE+ cells in LNs. Single-cell suspensions of LNs from non-Tg, IL-4 Tg mice at different stages of diseased mice were stimulated with PMA/ionomycin for IL-2, IL-4, IL-10 and IFN-γ analyses or stimulated by LPS for IL-12 analysis. Data shown are the summary of three similar experiments. (a) Representative dot-plot of intracellular cytokine staining from one of the three experiments. (b) Line graph of the cytokine expression in three experiments.
Fig. 4
Fig. 4
Intracellular IL-4 expression in keratinocytes of epidermal IL-4 Tg mice. Single-cell suspensions of skin from non-Tg mice and IL-4 Tg mice at Tg-BO, Tg-EL and Tg-LL were stained with anti-CD11a, CD49f and anti-IL-4 followed FACS analysis as described in the Materials and methods section. CD11a/CD49f+ cells were gated as keratinocytes. Data shown are the average frequencies of keratinocytes IL-4 intracellular expression in three experiments. *Significant increase compared to non-Tg; ♯significant increase compared to Tg-BO; ¶significant increase compared to Tg-EL.
Fig. 5
Fig. 5
Intracellular IL-2, IL-4, IL-10 and IFN-γ expression in CD3+ cells and IL-12 expression in IA-IE+ cells in the skin. Single-cell suspensions of skin from early and late stages of disease mice were stimulated with PMA/ionomycin for IL-2, IL-4, IL-10 and IFN-γ analyses or stimulated by LPS for IL-12 analysis as described in the Materials and methods section. Data shown are a summary of three similar experiments.
Fig. 6
Fig. 6
Proposed immunological pathway in the IL-4 Tg AD mouse model. Before onset: unknown antigens or allergens activate LC. IL-1β promotes LC to migrate to skin-draining LN. Activated LC and IL-4 convert Th0 to Th2 cells in the skin-draining LN. Up-regulated ICAM-1/VCAM-1 on blood vessels induced by IL-4 and skin-homing chemokine (CCL27) produced by keratinocytes promote Th2 cell to migrate into the skin. IL-4 stimulate mast cells to produce Th2 cytokines. Early lesion stage: as inflammatory cells build up in the skin, clinical inflammation is now observed. Th2 cells produce IL-4, IL-5, IL-6, IL-10 and IL-13, which create a predominant Th2 environment. In addition, IL-4 induce B cell ɛ chain switching, inducing production of IgE, which upon binding mast cells causes further Th2 cytokine production. At the same time, IL-12 generated from activated DC/LC and Mφ stimulates Th0 to Th1 cells, resulting in some Th1 cytokine secretion in the skin. Late lesion stage: as more Th1 lymphocytes infiltrate the skin, they produce larger amounts of Th1 cytokine IFN-γ and a new surge of TNF-β, both of which create a predominant Th1 milieu in the presence of Th2 cytokines. *Initiation step; →: induction/production;formula image
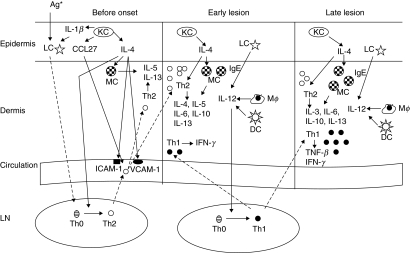
: migration, LC: Langerhans cells; DC, dendritic cells; KC, keratinocytes; MC, mast cells; Mφ, macrophages; •: Th1 lymphocytes; ○: Th2 lymphocytes; LN, skin-draining lymph node.

Similar articles

Cited by

References

    1. Leung DY, Bieber T. Atopic dermatitis. Lancet. 2003;361:151–60. - PubMed
    1. Leung DYM, Jain N, Leo HL. New concepts in the pathogenesis of atopic dermatitis. Curr Opin Immunol. 2003;15:634–8. - PubMed
    1. Hanifin JM. Immunologic aspects of atopic dermatitis. Dermatol Clin. 1990;8:747–50. - PubMed
    1. Cooper KD, Stevens SR. T cells in atopic dermatitis. J Am Acad Dermatol. 2001;45(Suppl. 1):S10–12. - PubMed
    1. Cooper KD. Atopic dermatitis: recent trends in pathogenesis and therapy. J Invest Dermatol. 1994;102:128–37. - PubMed

Publication types

MeSH terms