Comparative Study
. 2004 Nov 15;200(10):1347-58.
doi: 10.1084/jem.20040437.

Age-related CD8 T cell clonal expansions constrict CD8 T cell repertoire and have the potential to impair immune defense

Affiliations
Comparative Study

Age-related CD8 T cell clonal expansions constrict CD8 T cell repertoire and have the potential to impair immune defense

Ilhem Messaoudi et al. J Exp Med. .

Abstract

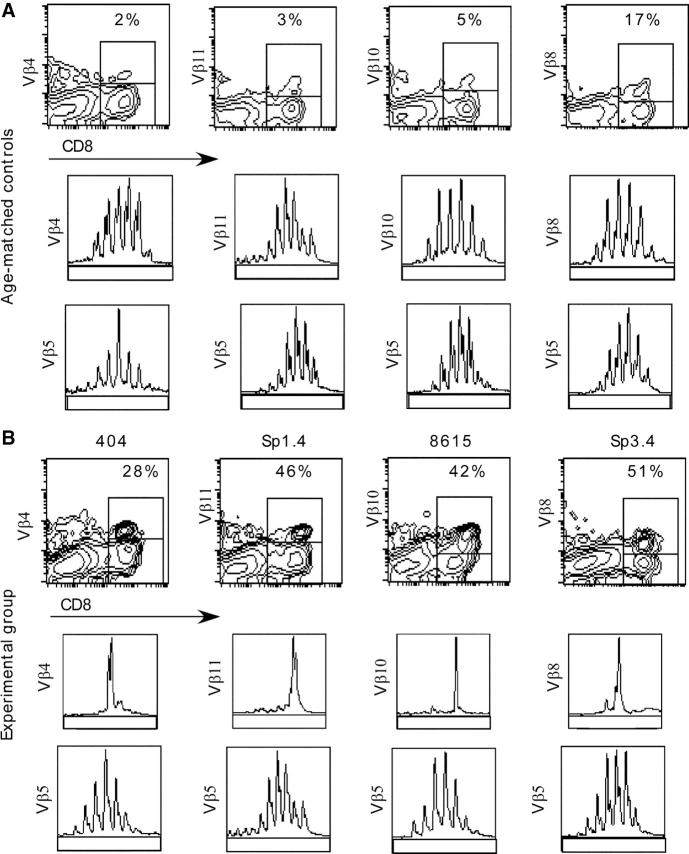
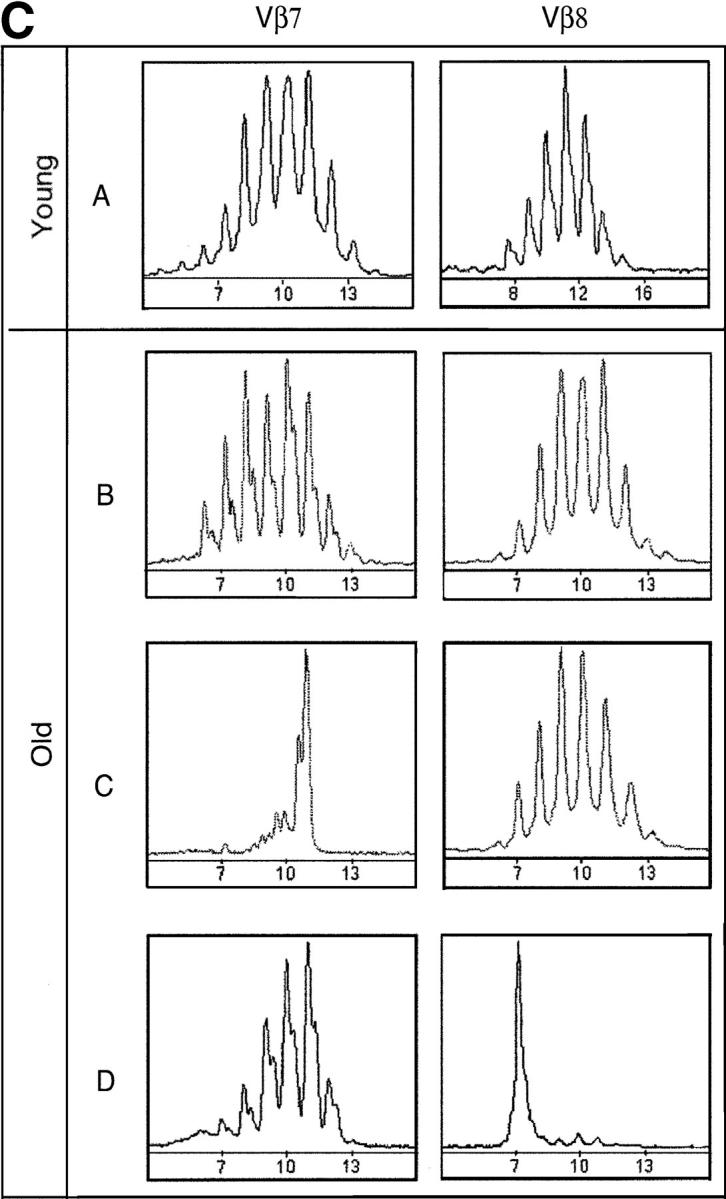
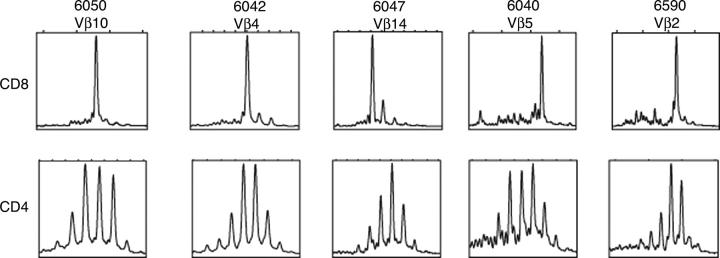
Peripheral T cell diversity is virtually constant in the young, but is invariably reduced in aged mice and humans. CD8+ T cell clonal expansions (TCE) are the most drastic manifestation of, and possible contributors to, this reduced diversity. We show that the presence of TCE results in reduced CD8+, but not CD4+, T cell diversity, and in functional inability to mobilize parts of the CD8+ T cell repertoire affected by TCE. In the model of herpes simplex virus (HSV)-1 infection of B6 mice, >90% of the responding CD8+ T cells use Vbeta10 or Vbeta8 and are directed against a single glycoprotein B (gB498-505) epitope, gB-8p. We found that old animals bearing CD8+ TCE within Vbeta10 or Vbeta8 families failed to mount an effective immune response against HSV-1, as judged by reduced numbers of peptide-major histocompatibility complex tetramer+ CD8 T cells and an absence of antiviral lytic function. Furthermore, Vbeta8 TCE experimentally introduced into young mice resulted in lower resistance to viral challenge, whereas Vbeta5+ TCE induced in a similar fashion did not impact viral resistance. These results demonstrate that age-related TCE functionally impair the efficacy of antiviral CD8+ T cell immunity in an antigen-specific manner, strongly suggesting that TCE are not the mere manifestation of, but are also a contributing factor to, the immunodeficiency of senescence.


Figures

Figure 1.
Figure 1.
TCE drastically disturb diversity of T cells in aging mice. Example of FCM and CDR3 length analysis of CD8 T cells in old animals without (A) or with (B) detectable TCE. Top of rows A and B show FCM analysis of splenocytes from individual mice for the expression of CD8 and indicated Vβ after hemisplenectomy (reference 9). Numbers denote percentage of Vβ1 cells within the CD8 subset. Mice shown in B had no other detectable TCE. Middle rows in rows A and B show CDR3 length analysis (reference 9) of those TCR families affected by TCE in mice from B. Note that every TCE corresponded to a single CDR3 length, confirmed by sequencing to be a single clone. On the bottom, TCE do not affect diversity of other TCRVβ families, as exemplified by Vβ5 profiles of all mice analyzed in this figure. The same pattern of polymorphic, gaussian-distributed peaks was seen in all other TCRVβ families (not depicted). (C) Independent regulation of related T cell subsets: TCE affect non-TCE cells within the same TCRVβ family, but not the cells outside this family, even if they are related by primary sequence to TCE cells. The CDR3 profile of young (A) and old mice (B–D) bearing either no (B), Vβ7 (C), or Vβ8 (D) TCE are shown. The presence of a TCE in Vβ8 subset does not affect the CDR3 length polymorphism of Vβ7 subset or vice versa.
Figure 1.
Figure 1.
TCE drastically disturb diversity of T cells in aging mice. Example of FCM and CDR3 length analysis of CD8 T cells in old animals without (A) or with (B) detectable TCE. Top of rows A and B show FCM analysis of splenocytes from individual mice for the expression of CD8 and indicated Vβ after hemisplenectomy (reference 9). Numbers denote percentage of Vβ1 cells within the CD8 subset. Mice shown in B had no other detectable TCE. Middle rows in rows A and B show CDR3 length analysis (reference 9) of those TCR families affected by TCE in mice from B. Note that every TCE corresponded to a single CDR3 length, confirmed by sequencing to be a single clone. On the bottom, TCE do not affect diversity of other TCRVβ families, as exemplified by Vβ5 profiles of all mice analyzed in this figure. The same pattern of polymorphic, gaussian-distributed peaks was seen in all other TCRVβ families (not depicted). (C) Independent regulation of related T cell subsets: TCE affect non-TCE cells within the same TCRVβ family, but not the cells outside this family, even if they are related by primary sequence to TCE cells. The CDR3 profile of young (A) and old mice (B–D) bearing either no (B), Vβ7 (C), or Vβ8 (D) TCE are shown. The presence of a TCE in Vβ8 subset does not affect the CDR3 length polymorphism of Vβ7 subset or vice versa.
Figure 2.
Figure 2.
CD8+ TCE preferentially impact cell numbers of other CD8+, but not of CD4+, cells. An illustrative example of the impact of a large CD8+ TCE (Vβ5, making up 86.8% of all CD8+ T cells) on other T cell families in mouse number 6040. Data are expressed as fold increase or decrease of absolute numbers of CD8+ or CD4+ T cells bearing different TCRVβ segments (other data for this and other mice, including percentage values, are shown in Table I). Note that even this large TCE shows little impact upon total CD4 counts (Table I) and that it exhibits most of its effects upon other CD8+ T cells, whereas scarcely affecting even those CD4+ T cells bearing the same TCR family (Vβ5).
Figure 3.
Figure 3.
CD8+ TCE do not reduce diversity of CD4+ cells belonging to the same Vβ family. CDR3 length analysis was performed on CD8-enriched (>88% CD8+, >1% CD4+) and CD4-enriched (>87% CD4+, >1% CD8+) cells from animals carrying TCE. Only the polymorphism of the family to which the TCE belongs is shown; however, no skewing was observed in any other CD8 or CD4 family. Representative examples from five individual mice (out of >20 analyzed) are shown.
Figure 4.
Figure 4.
TCE drastically impair the immune response of old mice. (A) TCE that affect the gB-8p–responding TCRVβ families selectively reduce the number of gB-8p–specific CD8 cells after viral infection. Mice from Table II were infected i.p. with 106 PFU HSV-1 strain 17 and their ex vivo response against the immunodominant peptide assessed by gB-8p:Kb tetramer staining. formula image ± SD are shown for all mice pooled from three experiments. Background tetramer staining of uninfected young and old controls was undetectable (<0.1%; not depicted). Differences between the Vβ8 and Vβ10 TCE, the age-matched and “other Vβ” TCE, and the age-matched and Vβ10 TCE groups were not statistically significant. Differences between all other groups were statistically significant at P < 0.05 or lower. The absolute number of CD8 splenocytes obtained from young and old animals was superimposable. (B) TCE prevent development of a CTL response. Standard 51Cr release assay was performed on cells analyzed in A after 5 d of in vitro restimulation with gB-8p–coated syngeneic spleen cells (reference 22). Data are shown as mean specific lysis ± SD of individual data from all mice from Table II analyzed in three separate experiments, with background obtained on peptide targets (<5%) subtracted.
Figure 5.
Figure 5.
Elimination of one responding TCRVβ family significantly reduces antiviral resistance. (A) 25 mice/group (two experiments) were treated with experimental (anti-Vβ8) or isotype-matched control mAbs (19E12, anti-Thy1.1) and infected with an otherwise sublethal dose of HSV-1 (1.5 × 10⁷ PFU/mouse, strain 17). Survival after 100 d is shown as average percent survival ± SD. All morbidity and mortality ensued within 7–14 d after infection. Survival after 100 d is shown as percent mean survival ± SD. (B) C57BL/6 mice were thymectomized at 5 wk of age and then depleted either of Vβ5 or Vβ8 T cells using a single injection of mAbs (MR9.4 and F23.1 clones, respectively), or left untreated (control group). The efficiency of T cell depletion was verified by FCM 2 wk after the antibody injection and immediately before viral challenge (4 mo later). At 5 mo of age, the animals depleted of Vβ5 T cells received a transfer of 20 × 106 OT-1 T cells, and those depleted of Vβ8 received 20 × 106 2C T cells. Transfer success was assessed using FCM 24 h later. The animals were rested for an additional 24 h before viral challenge with 6 × 10⁷ HSV-I strain 17, clone syn2+. This dose was shown reliably in our laboratory to kill ∼40% unmanipulated, 4-mo-old C57BL/7 mice. A total of 12 animals/group was used. Survival after 100 d is shown as average percent survival ± SD as explained above.

References

    1. Miller, R.A. 1996. The aging immune system: primer and prospectus. Science. 273:70–74. - PubMed
    1. Pawelec, G., M. Adibzadeh, R. Solana, and I. Beckman. 1997. The T cell in the ageing individual. Mech. Ageing Dev. 93:35–45. - PubMed
    1. Ku, C.C., B. Kotzin, J. Kappler, and P. Marrack. 1997. CD8+ T-cell clones in old mice. Immunol. Rev. 160:139–144. - PubMed
    1. Globerson, A., and R.B. Effros. 2000. Ageing of lymphocytes and lymphocytes in the aged. Immunol. Today. 21:515–521. - PubMed
    1. Hingorani, R., I.H. Choi, P. Akolkar, B. Gulwani-Akolkar, R. Pergolizzi, J. Silver, and P.K. Gregersen. 1993. Clonal predominance of T cell receptors within the CD8+ CD45 RO+ subset in normal human subjects. J. Immunol. 151:5762–5769. - PubMed

Publication types

Substances