. 2004 Dec;124(6):691-701.
doi: 10.1085/jgp.200409128. Epub 2004 Nov 15.

Block of inactivation-deficient Na+ channels by local anesthetics in stably transfected mammalian cells: evidence for drug binding along the activation pathway

Affiliations

Block of inactivation-deficient Na+ channels by local anesthetics in stably transfected mammalian cells: evidence for drug binding along the activation pathway

Sho-Ya Wang et al. J Gen Physiol. 2004 Dec.

Abstract

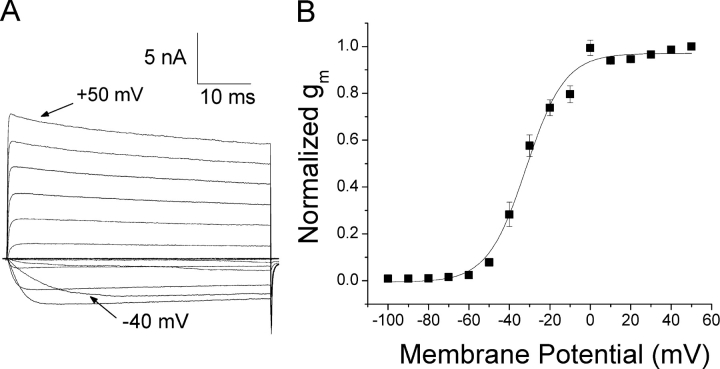
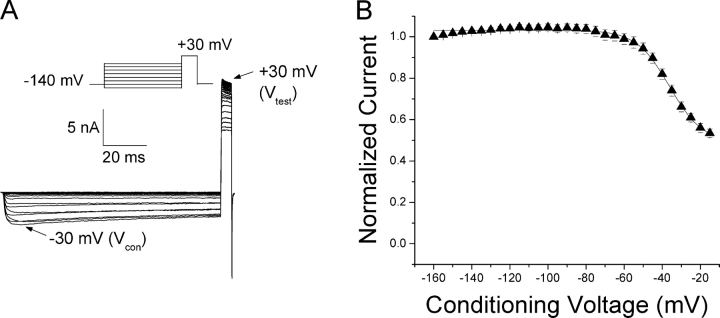
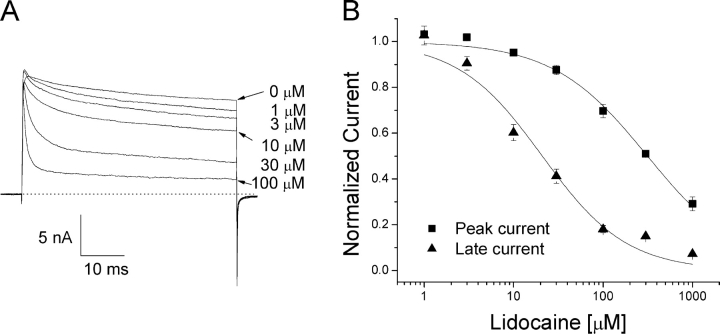
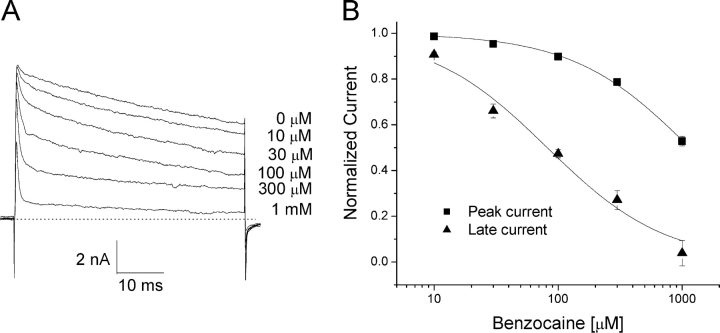
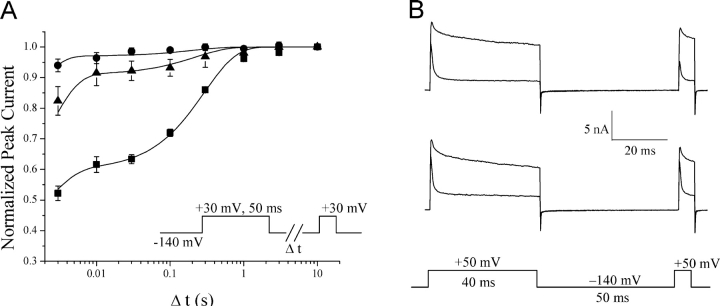
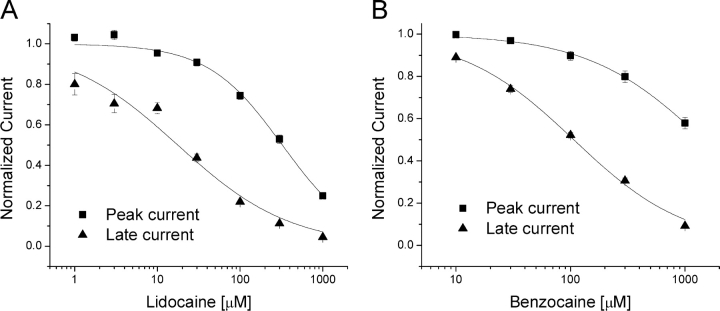
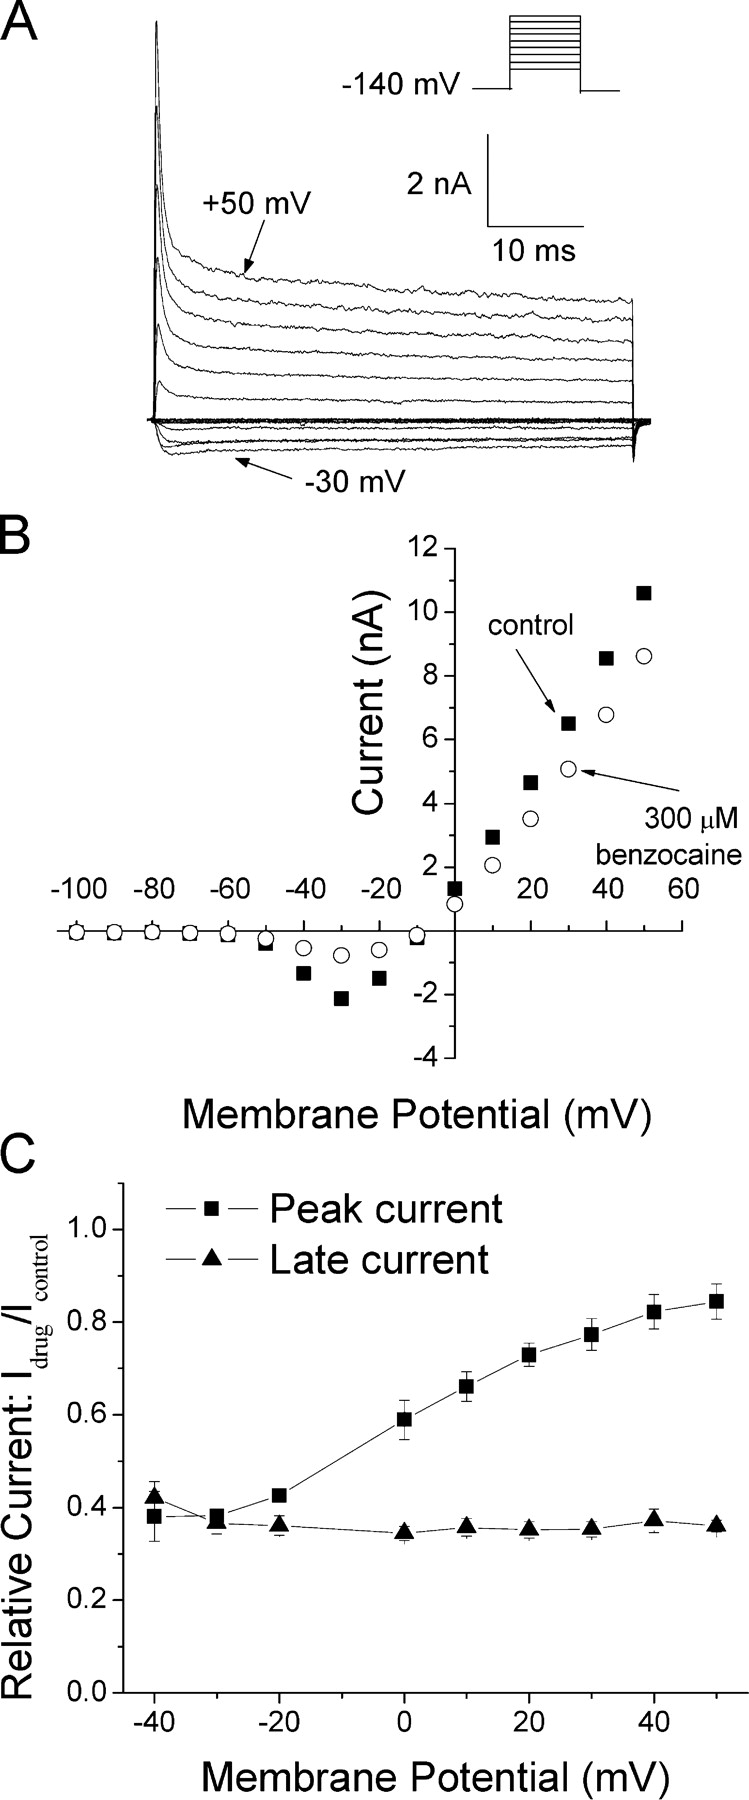
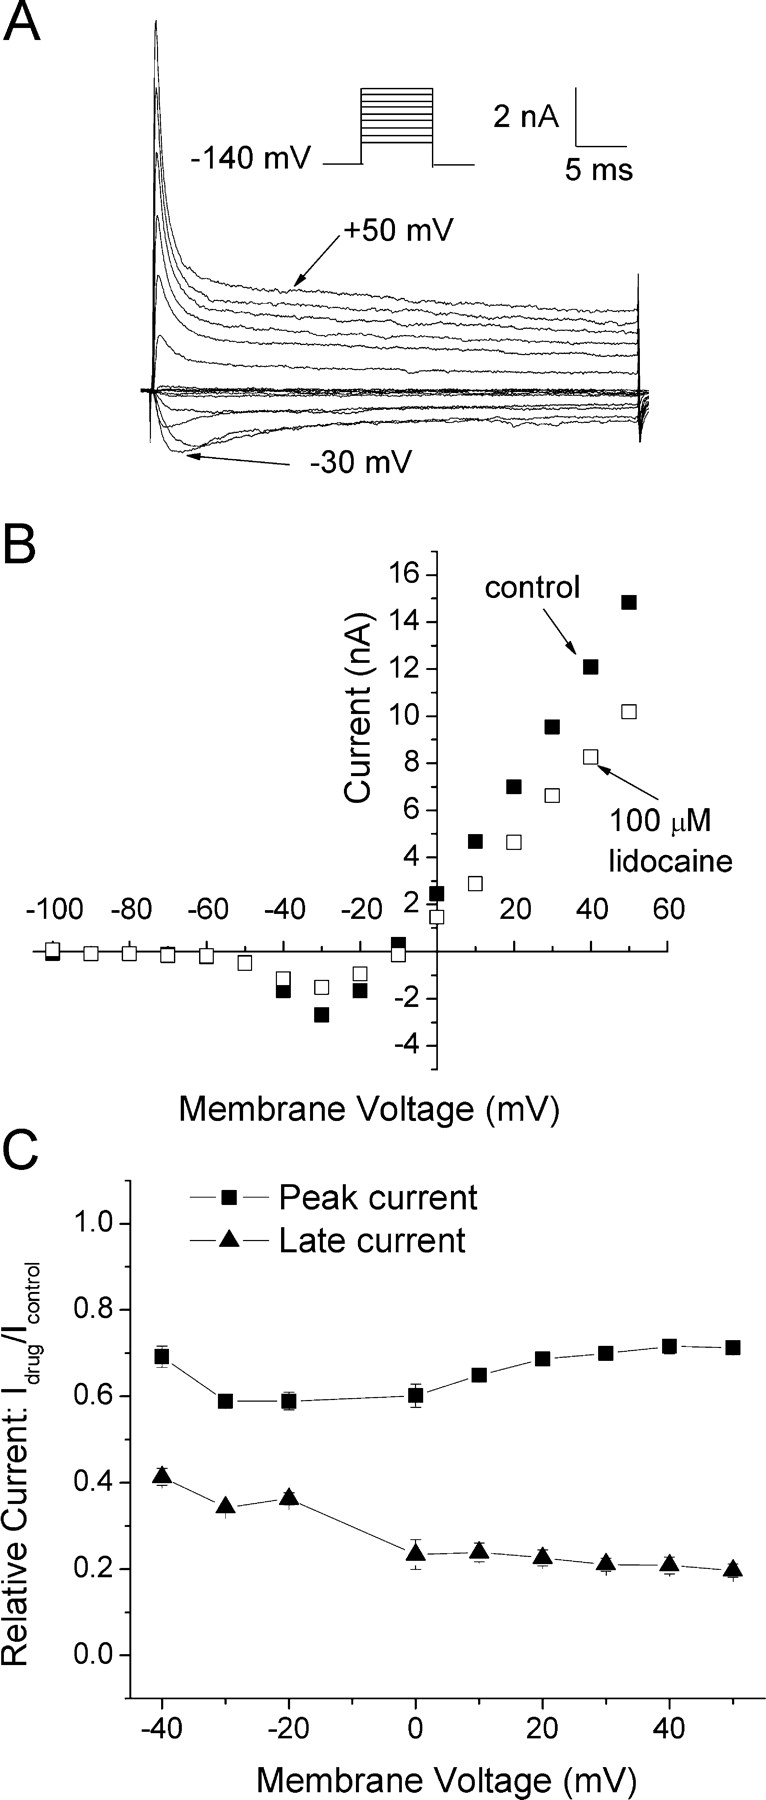
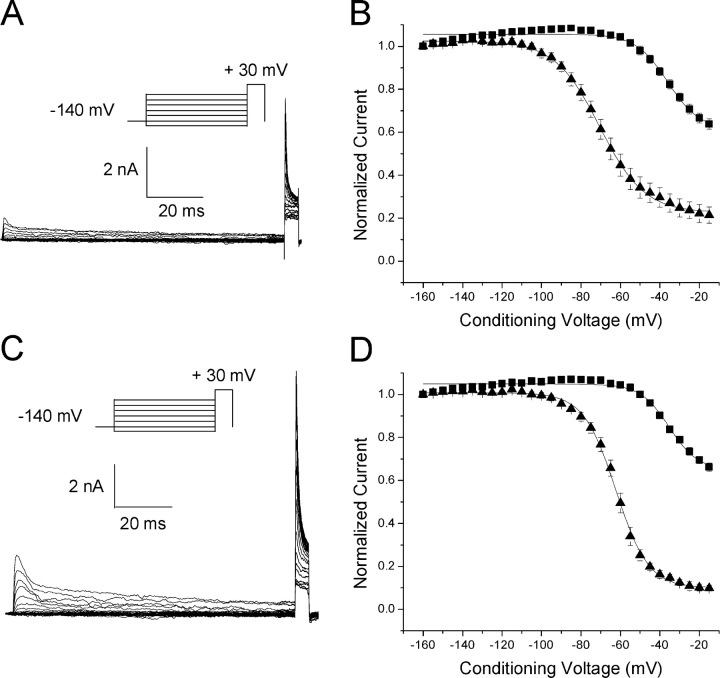
According to the classic modulated receptor hypothesis, local anesthetics (LAs) such as benzocaine and lidocaine bind preferentially to fast-inactivated Na(+) channels with higher affinities. However, an alternative view suggests that activation of Na(+) channels plays a crucial role in promoting high-affinity LA binding and that fast inactivation per se is not a prerequisite for LA preferential binding. We investigated the role of activation in LA action in inactivation-deficient rat muscle Na(+) channels (rNav1.4-L435W/L437C/A438W) expressed in stably transfected Hek293 cells. The 50% inhibitory concentrations (IC(50)) for the open-channel block at +30 mV by lidocaine and benzocaine were 20.9 +/- 3.3 microM (n = 5) and 81.7 +/- 10.6 microM (n = 5), respectively; both were comparable to inactivated-channel affinities. In comparison, IC(50) values for resting-channel block at -140 mV were >12-fold higher than those for open-channel block. With 300 microM benzocaine, rapid time-dependent block (tau approximately 0.8 ms) of inactivation-deficient Na(+) currents occurred at +30 mV, but such a rapid time-dependent block was not evident at -30 mV. The peak current at -30 mV, however, was reduced more severely than that at +30 mV. This phenomenon suggested that the LA block of intermediate closed states took place notably when channel activation was slow. Such closed-channel block also readily accounted for the LA-induced hyperpolarizing shift in the conventional steady-state inactivation measurement. Our data together illustrate that the Na(+) channel activation pathway, including most, if not all, transient intermediate closed states and the final open state, promotes high-affinity LA binding.


Figures

F<sc>igure</sc> 1.
Figure 1.
Activation of rNav1.4-WCW mutant Na+ channels. (A) Currents were evoked by 50-ms test pulses from −100 to +50 mV in 10-mV increments. (B) Normalized membrane conductance (gm) was plotted against the voltage. gm was calculated from the equation gm = INa/(Em − ENa), where INa is the peak current, Em is the amplitude of the voltage step, and ENa is the estimated reversal potential of the Na+ current. Plots were fitted with a Boltzmann function (1/[1 + exp((V0.5 − V)/k)]). The average midpoint voltage (V0.5) and slope (k) were −31.7 ± 1.2 mV and 9.6 ± 1.0 mV, respectively (n = 6). Holding potential was set at −140 mV.
F<sc>igure</sc> 2.
Figure 2.
Conventional steady-state inactivation measurement (h) of rNav1.4-WCW mutant Na+ channels. (A) Currents were evoked by a 5-ms test pulse (Vtest) at +30 mV. Test pulses were preceded by 100-ms conditioning pulses (Vcon), increasing in 5-mV increments from −160 to −15 mV (inset). (B) Normalized availability of rNav1.4-WCW mutant channels plotted as a function of the conditioning pulse voltage. The plot was fitted with a Boltzmann function. The average midpoint (V0.5) and slope (k) were −36.2 ± 0.9 mV and 8.7 ± 0.6 mV, respectively (n = 7). Holding potential was set at −140 mV.
F<sc>igure</sc> 3.
Figure 3.
Block of rNav1.4-WCW mutant currents by lidocaine. (A) Representative current traces are shown at various lidocaine concentrations. Cells were depolarized by a 50-ms test pulse at +30 mV. Pulses were delivered at 60-s intervals. (B) Peak and maintained late currents at the end of the test pulse as shown in A were measured at various lidocaine concentrations. Data were normalized to the control saline response and fitted with the Hill equation. The IC50 value for the peak current was 314 ± 25 μM (Hill coefficient, 0.8 ± 0.1) (▪, n = 5). For the maintained late current the IC50 was 20.9 ± 3.3 μM (0.9 ± 0.1) (▴, n = 5).
F<sc>igure</sc> 4.
Figure 4.
Block of rNav1.4-WCW Na+ currents by benzocaine. (A) Representative current traces are shown at various benzocaine concentrations. Cells were depolarized by a 50-ms test pulse at +30 mV. Pulses were delivered at 60-s intervals. (B) Peak currents and maintained late currents at the end of the test pulse as shown in A were measured at various benzocaine concentrations. Data were normalized to the control saline response and fitted with the Hill equation. The IC50 value for the peak current was 1.16 ± 0.05 mM (Hill coefficient, 0.9 ± 0.1) (▪, n = 5). For the maintained current, the IC50 was 81.7 ± 10.7 μM (0.9 ± 0.1) (▴, n = 5).
F<sc>igure</sc> 5.
Figure 5.
Recovery time courses from the open-channel block and additional use-dependent block by lidocaine and benzocaine. (A) Recovery time courses without (•) and with the open-channel block by lidocaine (▪) and benzocaine (▴) at the holding potential are plotted against normalized currents. The pulse protocol is shown in inset. The fitted values and number of experiments are given in the text. (B) Additional use-dependent block by lidocaine (top) but not by benzocaine (middle) is found in the second pulse. The pulse protocol is shown at the bottom. Peak currents before and after LAs are normalized and the mean values are given in the text.
F<sc>igure</sc> 6.
Figure 6.
Block of rNav1.4-WCW Na+ currents by lidocaine or by benzocaine without external Na+ ions. Cells were depolarized by a 50-ms test pulse at +30 mV. Pulses were delivered at 60-s intervals. Holding potential was set at −140 mV. (A) Dose–response curve of lidocaine is shown without external Na+ ions. Peak currents from the beginning of the test pulse and maintained late currents at the end of the pulse were measured as described in Fig. 3. Data were normalized to the control, plotted against lidocaine concentration, and fitted with the Hill equation. The IC50 value for the peak current was 324 ± 26 μM (Hill coefficient, 0.97 ± 0.07) (▪, n = 5). The IC50 for the maintained late current was 17.6 ± 3.2 μM (0.63 ± 0.07) (▴, n = 5). (B) Dose–response curve of benzocaine is shown without external Na+ ions. Peak and maintained late currents were measured as described in Fig. 4, normalized, plotted against benzocaine concentration, and fitted with the Hill equation. The IC50 for the peak current was 1.45 ± 0.07 mM (0.86 ± 0.03) (▪, n = 5). The IC50 for the maintained late current was 107 ± 6 μM (0.88 ± 0.04) (▴, n = 5).
F<sc>igure</sc> 7.
Figure 7.
Current–voltage relationship in the presence of 300 μM benzocaine. (A) A representative family of Na+ currents were evoked by 50-ms test pulses increasing in 10-mV increments from −100 to +50 mV (pulse protocol shown in inset) in the presence of 300 μM benzocaine. Holding potential was set at −140 mV. Control data similar to those illustrated in Fig. 1 A in the absence of drug were not shown. (B) Peak currents for control (▪) and 300 μM benzocaine (○) were plotted against membrane voltage. (C) Both peak (▪, n = 4) and persistent (▴, n = 4) late currents at the end of the test pulse as shown in A were measured, normalized to peak currents measured from the same cell in control saline (Idrug/Icontrol), and plotted against membrane voltage.
F<sc>igure</sc> 8.
Figure 8.
Current–voltage relationship in the presence of 100 μM lidocaine. (A) A representative family of Na+ currents were evoked by 50-ms test pulses increasing in 10-mV increments from −100 to +50 mV (inset) in the presence of 100 μM lidocaine. Control data similar to those illustrated in Fig. 1 A without drug were not shown. (B) Peak currents for control (▪) and 100 μM lidocaine (□) were plotted against membrane voltage. (C) Both peak (▪, n = 5) and persistent (▴, n = 5) late currents as shown in A were measured, normalized to peak currents measured from the same cell in control saline (Idrug/Icontrol), and plotted against membrane voltage.
F<sc>igure</sc> 9.
Figure 9.
Conventional h measurement of rNav1.4-WCW Na+ channels with LAs presence. (A) Superimposed current traces were evoked by a 5-ms test pulse to +30 mV in the presence 300 μM benzocaine. Test pulses were preceded by 100-ms conditioning pulses, ranging from −160 to −15 mV in 5-mV increments (inset). Notice that Na+ currents were activated at the conditioning pulse >−50 mV. (B) Peak currents at the test pulse of +30 mV were measured, normalized, and plotted as a function of the conditioning voltage. The plot was fitted with a Boltzmann function (1/[1 + exp((V0.5 − V)/k)]). The average midpoint (V0.5) and slope (k) for the control were −36.0 ± 1.77 mV and 8.2 ± 1.2 mV, respectively (▪, n = 5), and for the cells treated with benzocaine were −70.5 ± 0.4 mV and 11.3 ± 0.3 mV, respectively (▴, n = 5). (C) Currents were evoked as described (A) in the presence of 300 μM lidocaine. (D) Normalized Na+ current availability, plotted as in B, and fitted with a Boltzmann function. The average midpoint (V0.5) and slope (k) for the control were −35.3 ±1.5 mV and 7.3 ± 1.0 mV, respectively (▪, n = 6), and for cells treated with lidocaine were −62.3 ± 0.3 mV and 8.2 ± 0.3 mV, respectively (▴, n = 6). All cells were perfused with external solution containing no Na+ ions.

Similar articles

Cited by

References

    1. Aldrich, R.W., D.P. Corey, and C.F. Stevens. 1983. A reinterpretation of mammalian sodium channel gating based on single channel recording. Nature. 306:436–441. - PubMed
    1. An, R.H., R. Bangalore, S.Z. Rosero, and R.S. Kass. 1996. Lidocaine block of LQT-3 mutant human Na+ channels. Circ. Res. 79:103–108. - PubMed
    1. Armstrong, C.M. 1971. Interaction of tetraethylammonium ion derivatives with the potassium channels of giant axons. J. Gen. Physiol. 58:413–437. - PMC - PubMed
    1. Barber, M.J., D.J. Wendt, C.F. Starmer, and A.O. Grant. 1992. Blockade of cardiac sodium channels: competition between the permeant ion and antiarrhythmic drugs. J. Clin. Invest. 90:368–381. - PMC - PubMed
    1. Bean, B.P., C.J. Cohen, and R.W. Tsien. 1983. Lidocaine block of cardiac sodium channels. J. Gen. Physiol. 81:613–642. - PMC - PubMed

Publication types

MeSH terms