Intraspecies sequence comparisons for annotating genomes
- PMID: 15545499
- PMCID: PMC534664
- DOI: 10.1101/gr.3199704
Intraspecies sequence comparisons for annotating genomes
Abstract
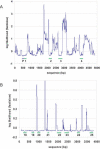
Analysis of sequence variation among members of a single species offers a potential approach to identify functional DNA elements responsible for biological features unique to that species. Due to its high rate of allelic polymorphism and ease of genetic manipulability, we chose the sea squirt, Ciona intestinalis, to explore intraspecies sequence comparisons for genome annotation. A large number of C. intestinalis specimens were collected from four continents, and a set of genomic intervals were amplified, resequenced, and analyzed to determine the mutation rates at each nucleotide in the sequence. We found that regions with low mutation rates efficiently demarcated functionally constrained sequences: these include a set of noncoding elements, which we showed in C. intestinalis transgenic assays to act as tissue-specific enhancers, as well as the location of coding sequences. This illustrates that comparisons of multiple members of a species can be used for genome annotation, suggesting a path for the annotation of the sequenced genomes of organisms occupying uncharacterized phylogenetic branches of the animal kingdom. It also raises the possibility that the resequencing of a large number of Homo sapiens individuals might be used to annotate the human genome and identify sequences defining traits unique to our species.
Figures


References
-
- Ansari-Lari, M.A., Oeltjen, J.C., Schwartz, S., Zhang, Z., Muzny, D.M., Lu, J., Gorrell, J.H., Chinault, A.C., Belmont, J.W., Miller, W., et al. 1998. Comparative sequence analysis of a gene-rich cluster at human chromosome 12p13 and its syntenic region in mouse chromosome 6. Genome Res. 8: 29-40. - PubMed
-
- Boffelli, D., McAuliffe, J., Ovcharenko, D., Lewis, K.D., Ovcharenko, I., Pachter, L., and Rubin, E.M. 2003. Phylogenetic shadowing of primate sequences to find functional regions of the human genome. Science 299: 1391-1394. - PubMed
-
- Collins, F.S., Green, E.D., Guttmacher, A.E., and Guyer, M.S. 2003. A vision for the future of genomics research. Nature 422: 835-847. - PubMed
-
- Corbo, J.C., Erives, A., Di Gregorio, A., Chang, A., and Levine, M. 1997a. Dorsoventral patterning of the vertebrate neural tube is conserved in a protochordate. Development 124: 2335-2344. - PubMed
Web site references
-
- http://bonaire.lbl.gov/newshadower/; phylogenetic shadowing.
-
- www.phrap.org; consed suite.
-
- www.ebi.ac.uk/clustalw/index.html; multiple sequence alignment.
-
- baboon.math.berkeley.edu/mavid; multiple sequence alignment.
Publication types
MeSH terms
Substances
Associated data
- Actions
- Actions
- Actions
- Actions
- Actions
- Actions
- Actions
- Actions
- Actions
- Actions
- Actions
- Actions
- Actions
- Actions
- Actions
- Actions
- Actions
- Actions
- Actions
- Actions
- Actions
- Actions
- Actions
- Actions
- Actions
- Actions
- Actions
- Actions
- Actions
- Actions
- Actions
- Actions
- Actions
- Actions
- Actions
- Actions
- Actions
- Actions
- Actions
- Actions
- Actions
- Actions
- Actions
- Actions
- Actions
- Actions
- Actions
- Actions
- Actions
- Actions
- Actions
- Actions
- Actions
- Actions
- Actions
- Actions
- Actions
- Actions
- Actions
- Actions
- Actions
- Actions
- Actions
- Actions
- Actions
- Actions
- Actions
- Actions
- Actions
- Actions
- Actions
- Actions
- Actions
- Actions
- Actions
- Actions
- Actions
- Actions
- Actions
- Actions
- Actions
- Actions
- Actions
- Actions
- Actions
- Actions
- Actions
- Actions
- Actions
- Actions
- Actions
- Actions
- Actions
- Actions
- Actions
- Actions
- Actions
- Actions
- Actions
- Actions
- Actions
- Actions
- Actions
- Actions
- Actions
- Actions
- Actions
- Actions
- Actions
- Actions
- Actions
- Actions
- Actions
- Actions
- Actions
- Actions
- Actions
- Actions
- Actions
- Actions
- Actions
- Actions
- Actions
- Actions
- Actions
- Actions
- Actions
- Actions
- Actions
- Actions
LinkOut - more resources
Full Text Sources
Other Literature Sources
