Molecular evolution of dinoflagellate luciferases, enzymes with three catalytic domains in a single polypeptide
- PMID: 15545598
- PMCID: PMC534537
- DOI: 10.1073/pnas.0407597101
Molecular evolution of dinoflagellate luciferases, enzymes with three catalytic domains in a single polypeptide
Abstract
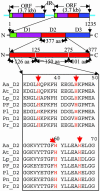
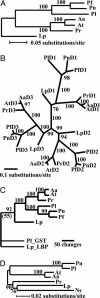
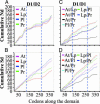
Enzymes with multiple catalytic sites are rare, and their evolutionary significance remains to be established. This study of luciferases from seven dinoflagellate species examines the previously undescribed evolution of such proteins. All these enzymes have the same unique structure: three homologous domains, each with catalytic activity, preceded by an N-terminal region of unknown function. Both pairwise comparison and phylogenetic inference indicate that the similarity of the corresponding individual domains between species is greater than that between the three different domains of each polypeptide. Trees constructed from each of the three individual domains are congruent with the tree of the full-length coding sequence. Luciferase and ribosomal DNA trees both indicate that the Lingulodinium polyedrum luciferase diverged early from the other six. In all species, the amino acid sequence in the central regions of the three domains is strongly conserved, suggesting it as the catalytic site. Synonymous substitution rates also are greatly reduced in the central regions of two species but not in the other five. This lineage-specific difference in synonymous substitution rates in the central region of the domains correlates inversely with the content of GC3, which can be accounted for by the biased usage toward C-ending codons at the degenerate sites. RNA modeling of the central region of the L. polyedrum luciferase domain suggests a function of the constrained synonymous substitutions in the circadian-controlled protein synthesis.
Figures


Similar articles
-
Two different domains of the luciferase gene in the heterotrophic dinoflagellate Noctiluca scintillans occur as two separate genes in photosynthetic species.Proc Natl Acad Sci U S A. 2007 Jan 16;104(3):696-701. doi: 10.1073/pnas.0607816103. Epub 2006 Nov 27. Proc Natl Acad Sci U S A. 2007. PMID: 17130452 Free PMC article.
-
Members of a dinoflagellate luciferase gene family differ in synonymous substitution rates.Biochemistry. 2001 Dec 25;40(51):15862-8. doi: 10.1021/bi011651q. Biochemistry. 2001. PMID: 11747464
-
Three functional luciferase domains in a single polypeptide chain.Proc Natl Acad Sci U S A. 1997 Aug 19;94(17):8954-8. doi: 10.1073/pnas.94.17.8954. Proc Natl Acad Sci U S A. 1997. PMID: 9256416 Free PMC article.
-
Molecular evolution before the origin of species.Prog Biophys Mol Biol. 2002 May-Jul;79(1-3):77-133. doi: 10.1016/s0079-6107(02)00012-3. Prog Biophys Mol Biol. 2002. PMID: 12225777 Review.
-
Evolution of viral DNA-dependent RNA polymerases.Virus Genes. 1995;11(2-3):271-84. doi: 10.1007/BF01728665. Virus Genes. 1995. PMID: 8828152 Review.
Cited by
-
Crystal structure of a pH-regulated luciferase catalyzing the bioluminescent oxidation of an open tetrapyrrole.Proc Natl Acad Sci U S A. 2005 Feb 1;102(5):1378-83. doi: 10.1073/pnas.0409335102. Epub 2005 Jan 21. Proc Natl Acad Sci U S A. 2005. PMID: 15665092 Free PMC article.
-
Two different domains of the luciferase gene in the heterotrophic dinoflagellate Noctiluca scintillans occur as two separate genes in photosynthetic species.Proc Natl Acad Sci U S A. 2007 Jan 16;104(3):696-701. doi: 10.1073/pnas.0607816103. Epub 2006 Nov 27. Proc Natl Acad Sci U S A. 2007. PMID: 17130452 Free PMC article.
-
Preparation and analysis of an expressed sequence tag library from the toxic dinoflagellate Alexandrium catenella.Mar Biotechnol (NY). 2008 Nov-Dec;10(6):692-700. doi: 10.1007/s10126-008-9107-8. Epub 2008 May 14. Mar Biotechnol (NY). 2008. PMID: 18478293
-
Availability and occurrence of coelenterazine in a Swedish fjord to maintain Amphiura filiformis bioluminescence.Sci Rep. 2024 Dec 30;14(1):31803. doi: 10.1038/s41598-024-82811-y. Sci Rep. 2024. PMID: 39738292 Free PMC article.
-
Bioluminescent Dinoflagellates as a Bioassay for Toxicity Assessment.Int J Mol Sci. 2022 Oct 27;23(21):13012. doi: 10.3390/ijms232113012. Int J Mol Sci. 2022. PMID: 36361798 Free PMC article. Review.
References
Publication types
MeSH terms
Substances
Associated data
- Actions
- Actions
- Actions
- Actions
LinkOut - more resources
Full Text Sources

