

TNF receptor-associated factor (TRAF) domain and Bcl-2 cooperate to induce small B cell lymphoma/chronic lymphocytic leukemia in transgenic mice
- PMID: 15545599
- PMCID: PMC534512
- DOI: 10.1073/pnas.0407541101
TNF receptor-associated factor (TRAF) domain and Bcl-2 cooperate to induce small B cell lymphoma/chronic lymphocytic leukemia in transgenic mice
Abstract
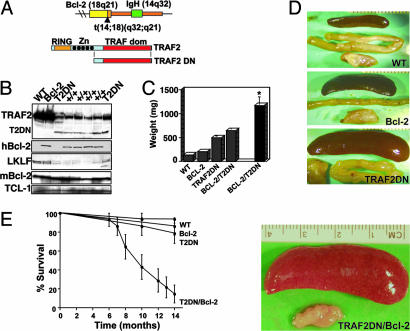
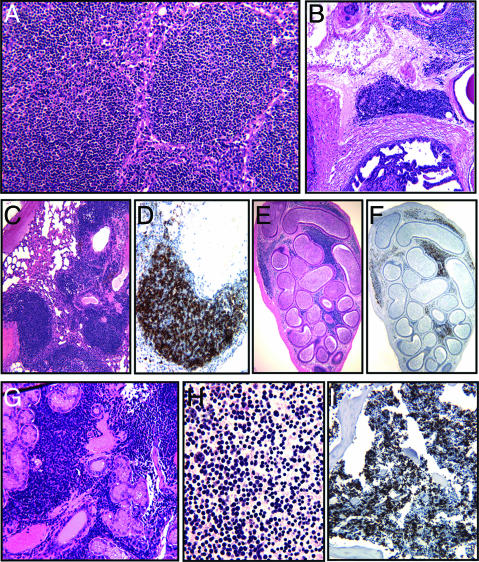
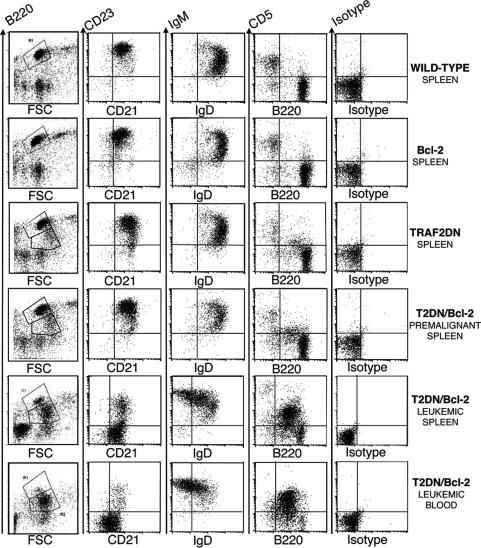
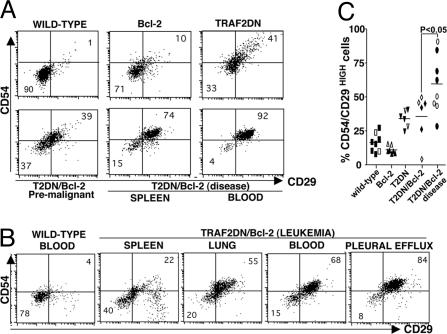
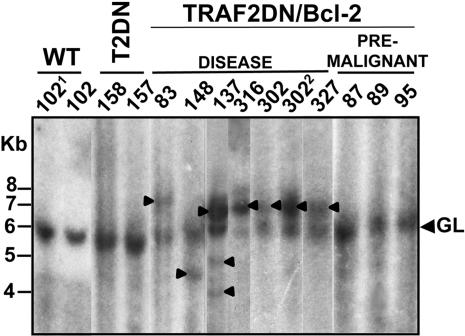
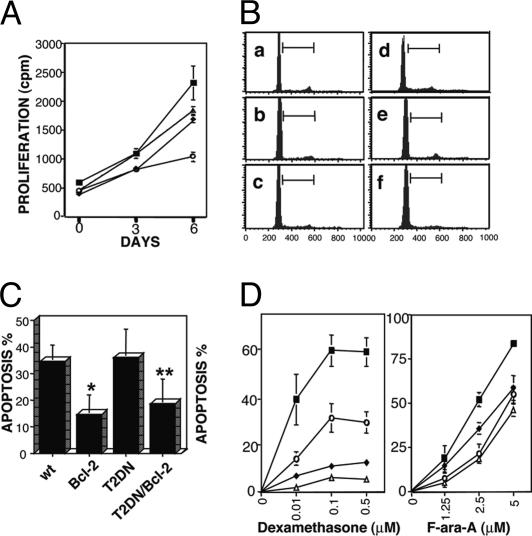
Transgenic mice overexpressing in B lymphocytes either Bcl-2 or a TNF receptor-associated factor (TRAF)2 mutant lacking the N-terminal RING and zinc finger domains located at the N terminus of the molecule (TRAF2DN), which mimics TRAF1, developed lymphadenopathy and splenomegaly due to polyclonal B cell expansion. Remarkably, TRAF2DN/Bcl-2 double-transgenic mice contained B cell populations similar to those observed in TRAF2DN mice. However, over time, they developed severe splenomegaly and lymphadenopathy, and most animals also developed leukemia, pleural effusion, and, in some cases, ascites associated with monoclonal and oligoclonal B cell neoplasms. The life span of TRAF2DN/Bcl-2 mice was markedly reduced compared with Bcl-2 and TRAF2DN single-transgenics or wild-type littermates. The expanded B cell population of TRAF2DN/Bcl-2 double-transgenic mice was primarily comprised of small/medium-size noncycling B220(M)/IgM(H)/IgD(L)/CD21(L)/CD23(NULL)/CD11b(+)/CD5+ cells that were Bcl-6-negative, consistent with a B-1 phenotype. The cells also expressed high levels of CD54 and other adhesion molecules. In vitro, these B cells showed comparable proliferation rates to those of wild-type counterparts but exhibited markedly increased survival and were resistant to apoptosis induced by chemotherapeutic agents and glucocorticoids. Histopathologic features were consistent with mouse small B cell lymphoma progressing to leukemia with many similarities to human chronic lymphocytic leukemia. Given that many human chronic lymphocytic leukemias overexpress TRAF1 and Bcl-2, our findings suggest that cooperation between Bcl-2 and TRAF pathways contributes to the development of this type of leukemia.
Figures
Similar articles
-
Dysregulated TRAF3 and BCL2 Expression Promotes Multiple Classes of Mature Non-hodgkin B Cell Lymphoma in Mice.Front Immunol. 2019 Jan 11;9:3114. doi: 10.3389/fimmu.2018.03114. eCollection 2018. Front Immunol. 2019. PMID: 30687320 Free PMC article.
-
TNFR-associated factor 2 deficiency in B lymphocytes predisposes to chronic lymphocytic leukemia/small lymphocytic lymphoma in mice.J Immunol. 2012 Jul 15;189(2):1053-61. doi: 10.4049/jimmunol.1200814. Epub 2012 Jun 18. J Immunol. 2012. PMID: 22711886 Free PMC article.
-
The Traf2DNxBCL2-tg Mouse Model of Chronic Lymphocytic Leukemia/Small Lymphocytic Lymphoma Recapitulates the Biased IGHV Gene Usage, Stereotypy, and Antigen-Specific HCDR3 Selection of Its Human Counterpart.Front Immunol. 2021 Apr 12;12:627602. doi: 10.3389/fimmu.2021.627602. eCollection 2021. Front Immunol. 2021. PMID: 33912159 Free PMC article.
-
B-chronic lymphocytic leukemia, small lymphocytic lymphoma, and lymphoplasmacytic lymphoma, including Waldenström's macroglobulinemia: a clinical, morphologic, and biologic spectrum of similar disorders.Semin Hematol. 1999 Apr;36(2):104-14. Semin Hematol. 1999. PMID: 10319379 Review.
-
Rituximab: a review of its use in non-Hodgkin's lymphoma and chronic lymphocytic leukaemia.Drugs. 2003;63(8):803-43. doi: 10.2165/00003495-200363080-00005. Drugs. 2003. PMID: 12662126 Review.
Cited by
-
Animal models of leukemia: any closer to the real thing?Cancer Metastasis Rev. 2013 Jun;32(1-2):63-76. doi: 10.1007/s10555-012-9405-5. Cancer Metastasis Rev. 2013. PMID: 23081702 Free PMC article. Review.
-
Dysregulated TRAF3 and BCL2 Expression Promotes Multiple Classes of Mature Non-hodgkin B Cell Lymphoma in Mice.Front Immunol. 2019 Jan 11;9:3114. doi: 10.3389/fimmu.2018.03114. eCollection 2018. Front Immunol. 2019. PMID: 30687320 Free PMC article.
-
miR deregulation in CLL.Adv Exp Med Biol. 2013;792:309-25. doi: 10.1007/978-1-4614-8051-8_14. Adv Exp Med Biol. 2013. PMID: 24014303 Free PMC article. Review.
-
Murine models of chronic lymphocytic leukaemia: role of microRNA-16 in the New Zealand Black mouse model.Br J Haematol. 2007 Dec;139(5):645-57. doi: 10.1111/j.1365-2141.2007.06851.x. Epub 2007 Oct 17. Br J Haematol. 2007. PMID: 17941951 Free PMC article. Review.
-
Optimized Xenograft Protocol for Chronic Lymphocytic Leukemia Results in High Engraftment Efficiency for All CLL Subgroups.Int J Mol Sci. 2019 Dec 12;20(24):6277. doi: 10.3390/ijms20246277. Int J Mol Sci. 2019. PMID: 31842407 Free PMC article.
References
-
- Kipps, T. (1997) Curr. Opin. Hematol. 4, 268–276. - PubMed
-
- Reed, J. (1998) Clin. Immunol. Newslett. 17, 125–140.
-
- Kitada, S., Pedersen, I. M., Schimmer, A. & Reed, J. C. (2002) Oncogene 21, 3459–3474. - PubMed
-
- Bradley, J. R. & Pober, J. S. (2001) Oncogene 20, 6482–6491. - PubMed
-
- Zapata, J. M. (2003) Exp. Opin. Ther. Targets 7, 411–425. - PubMed
Publication types
MeSH terms
Substances
Grants and funding
LinkOut - more resources
Full Text Sources
Other Literature Sources
Molecular Biology Databases
Research Materials
