. 2004 Nov 23;101(47):16577-82.
doi: 10.1073/pnas.0406767101. Epub 2004 Nov 15.

Integrative analysis of genome-scale data by using pseudoinverse projection predicts novel correlation between DNA replication and RNA transcription

Affiliations

Integrative analysis of genome-scale data by using pseudoinverse projection predicts novel correlation between DNA replication and RNA transcription

Orly Alter et al. Proc Natl Acad Sci U S A. .

Abstract

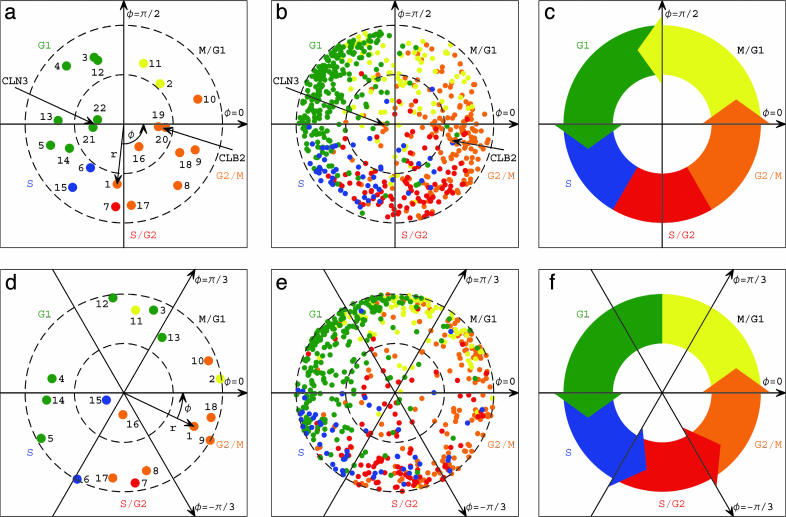
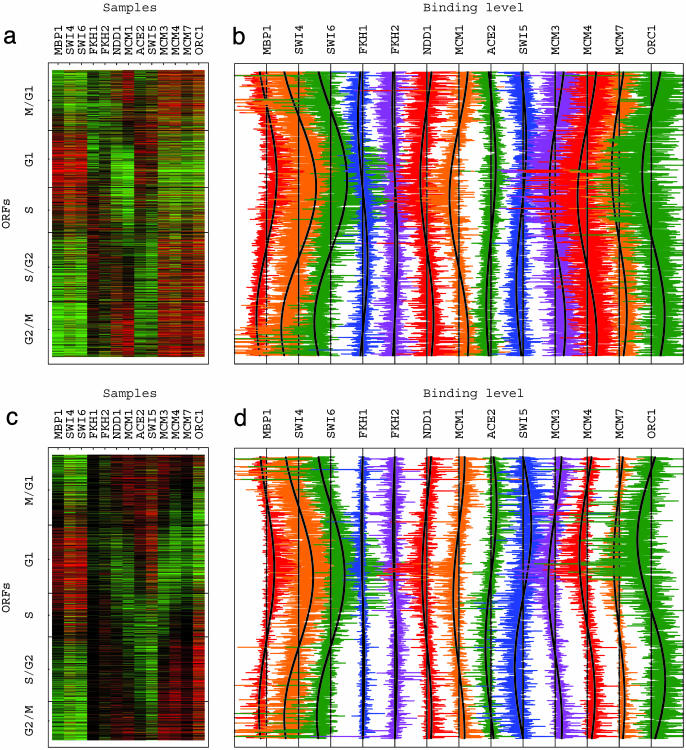
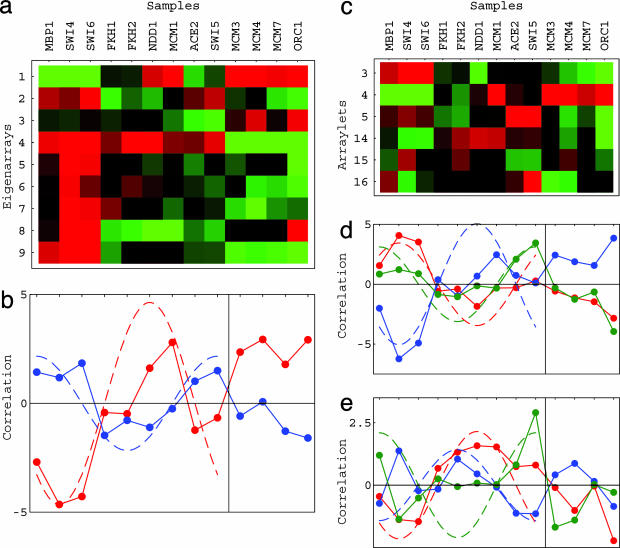
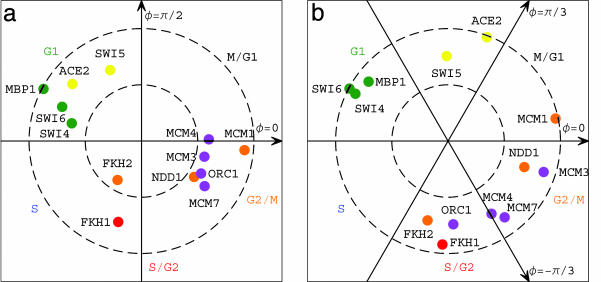
We describe an integrative data-driven mathematical framework that formulates any number of genome-scale molecular biological data sets in terms of one chosen set of data samples, or of profiles extracted mathematically from data samples, designated the "basis" set. By using pseudoinverse projection, the molecular biological profiles of the data samples are least-squares-approximated as superpositions of the basis profiles. Reconstruction of the data in the basis simulates experimental observation of only the cellular states manifest in the data that correspond to those of the basis. Classification of the data samples according to their reconstruction in the basis, rather than their overall measured profiles, maps the cellular states of the data onto those of the basis and gives a global picture of the correlations and possibly also causal coordination of these two sets of states. We illustrate this framework with an integration of yeast genome-scale proteins' DNA-binding data with cell cycle mRNA expression time course data. Novel correlation between DNA replication initiation and RNA transcription during the yeast cell cycle, which might be due to a previously unknown mechanism of regulation, is predicted.


Figures

Fig. 1.
Fig. 1.
The SVD (3, 4) and GSVD (5) cell cycle mRNA expression subspaces. (a) Normalized array correlation with the π/2-phase eigenarray along the y-axis vs. that with the 0-phase along the x-axis, color-coded according to the classification of the arrays into the five cell cycle stages by using combinatorics: M/G1 (yellow), G1 (green), S (blue), S/G2 (red), and G2/M (orange). The dashed unit and half-unit circles outline 100% and 25% of overall normalized array expression in this subspace. (b) Normalized correlation of each of the 646 cell cycle-regulated genes with the two corresponding eigengenes, color-coded according to either the traditional or microarray classifications. (c) The SVD picture of the yeast cell cycle. (d) Array expression, projected from the six-arraylets GSVD subspace onto π/2-phase along the y-axis vs. that onto 0-phase along the x-axis. The dashed unit and half-unit circles outline 100% and 50% of added up (rather than canceled out) contributions of the six arraylets to the overall projected expression. The arrows describe the projections of the –π/3-, 0-, and π/3-phase arraylets. (e) Expression of the 612 cell cycle-regulated genes, projected from the six-genelets GSVD subspace onto π/2-phase along the y-axis vs. that onto 0-phase along the x-axis. (f) The GSVD picture of the yeast cell cycle.
Fig. 2.
Fig. 2.
Pseudoinverse reconstruction of the proteins' DNA-binding data in the SVD (a and b) and GSVD (c and d) cell cycle mRNA expression bases, with the ORFs sorted according to their SVD- and GSVD phases, respectively. Raster displays (a and c), with overexpression (red), no change in expression (black), and underexpression (green), and line-joined graphs (b and d) of the SVD- and GSVD-reconstructed 13 binding profiles along 2,227 and 2,139 ORFs, centered at their sample- and ORF-invariant levels, show a traveling wave in the nine transcription factors and a standing wave in the four replication initiation proteins.
Fig. 3.
Fig. 3.
Pseudoinverse correlations of the proteins' DNA-binding data with the SVD (a and b) and GSVD (d and e) cell cycle mRNA expression bases. Shown are raster displays of ĉ, the correlations of the 13 binding profiles with the nine eigenarrays (a) and six arraylets (c) that span the SVD and GSVD bases, respectively. Also shown are line-joined graphs of the pseudoinverse correlations with the first (red) and second (blue) eigenarrays that span the SVD-cell cycle expression subspace (b), the third (red), fourth (blue), and fifth (green) arraylets (d), and the 14th (red), 15th (blue), and 16th (green) arraylets that span the GSVD cell cycle expression subspace (e).
Fig. 4.
Fig. 4.
Pseudoinverse mapping of the proteins' DNA-binding data onto the SVD (a) and GSVD (b) cell cycle mRNA expression subspaces. (a) Normalized sample correlation with the π/2-phase eigenarray along the y-axis vs. that with the 0-phase along the x-axis. (b) Sample binding projected from the six-arraylets GSVD subspace onto π/2-phase along the y-axis vs. that onto 0-phase along the x-axis.

References

    1. Bussemaker, H. J., Li, H. & Siggia, E. D. (2001) Nat. Genet. 27, 167–171. - PubMed
    1. Lu, P., Nakorchevskiy, A. & Marcotte, E. M. (2003) Proc. Natl. Acad. Sci. USA 100, 10370–10375. - PMC - PubMed
    1. Alter, O., Brown, P. O. & Botstein, D. (2000) Proc. Natl. Acad. Sci. USA 97, 10101–10106. - PMC - PubMed
    1. Alter, O., Brown, P. O. & Botstein, D. (2001) in Microarrays: Optical Technologies and Informatics, eds. Bittner, M. L., Chen, Y., Dorsel, A. N. & Dougherty, E. R. (Int. Soc. Optical Eng., Bellingham, WA), Vol. 4266, pp. 171–186.
    1. Alter, O., Brown, P. O. & Botstein, D. (2003) Proc. Natl. Acad. Sci. USA 100, 3351–3356. - PMC - PubMed

Publication types

LinkOut - more resources