

Fluorescent indicators of cAMP and Epac activation reveal differential dynamics of cAMP signaling within discrete subcellular compartments
- PMID: 15545605
- PMCID: PMC534508
- DOI: 10.1073/pnas.0405973101
Fluorescent indicators of cAMP and Epac activation reveal differential dynamics of cAMP signaling within discrete subcellular compartments
Abstract
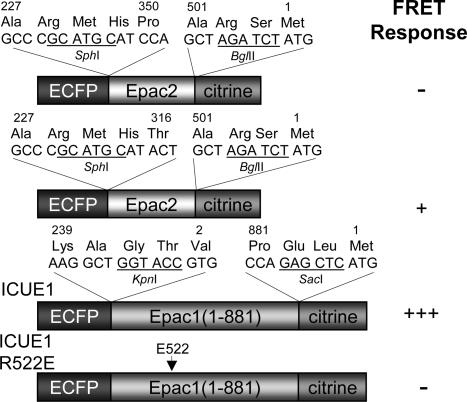
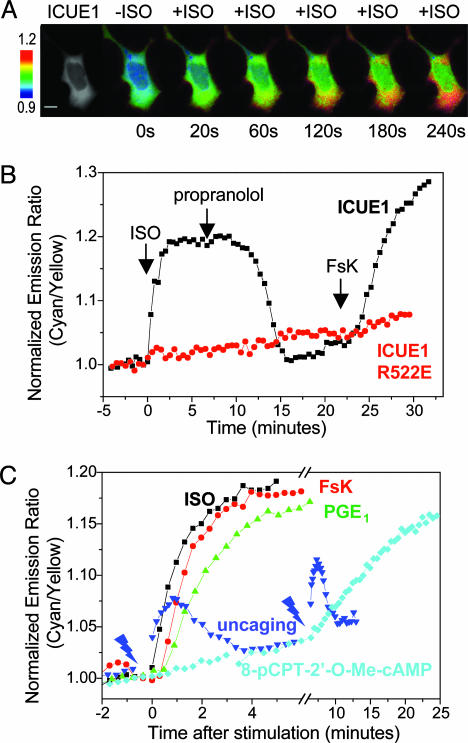
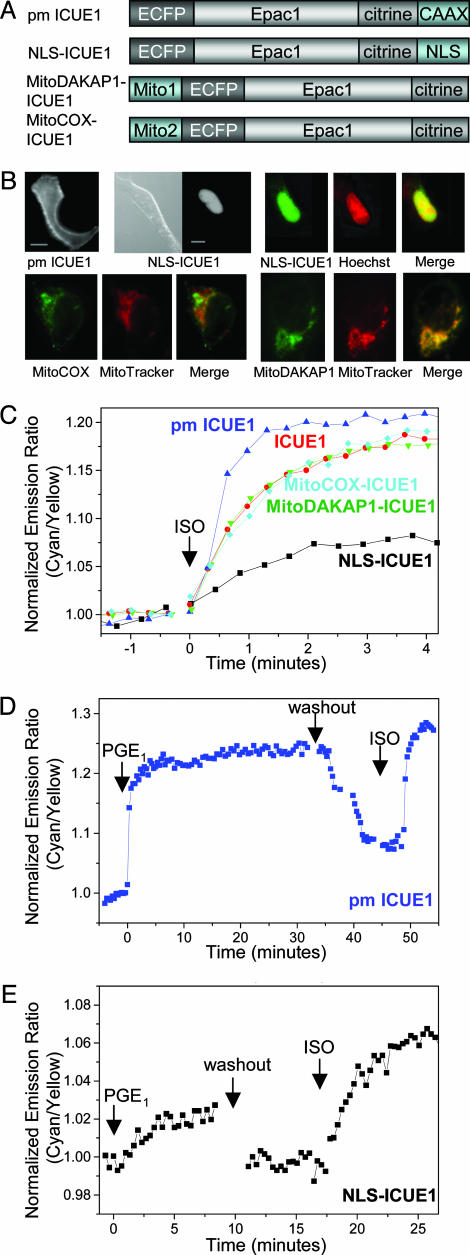
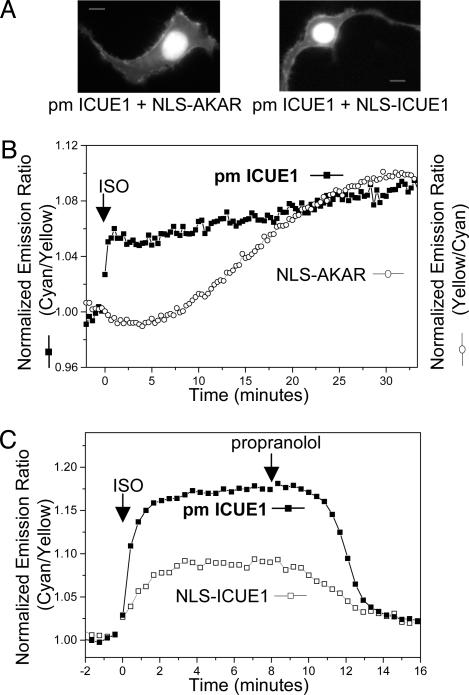
Second messenger cAMP regulates many cellular functions through its effectors, such as cAMP-dependent protein kinase (PKA) and Epac (exchange proteins directly activated by cAMP). Spatial and temporal control of cAMP signaling is crucial to differential regulation of cellular targets involved in various signaling cascades. To investigate the compartmentalized cAMP signaling, we constructed fluorescent indicators that report intracellular cAMP dynamics and Epac activation by sandwiching the full-length Epac1 between cyan and yellow mutants of GFP. Elevations of cAMP decreased FRET and increased the ratio of cyan-to-yellow emissions by 10-30% in living mammalian cells. This response can be reversed by removing cAMP-elevating agents and abolished by mutating the critical residue responsible for cAMP binding. Targeting of the reporter to the plasma membrane, where cAMP is produced in response to the activation of beta-adrenergic receptor, revealed a faster cAMP response at the membrane than in the cytoplasm and mitochondria. Simultaneous imaging with targeted cAMP indicator and PKA activity reporter allowed the detection of a much delayed PKA response in the nucleus after the rapid accumulation of cAMP at the plasma membrane of the same cell, despite the immediate presence of a pool of cAMP in the nucleus. Thus, cAMP dynamics and the activation of its effectors are precisely controlled spatiotemporally in vivo.
Figures
Similar articles
-
Detecting cAMP-induced Epac activation by fluorescence resonance energy transfer: Epac as a novel cAMP indicator.EMBO Rep. 2004 Dec;5(12):1176-80. doi: 10.1038/sj.embor.7400290. EMBO Rep. 2004. PMID: 15550931 Free PMC article.
-
PGE(1) stimulation of HEK293 cells generates multiple contiguous domains with different [cAMP]: role of compartmentalized phosphodiesterases.J Cell Biol. 2006 Nov 6;175(3):441-51. doi: 10.1083/jcb.200605050. J Cell Biol. 2006. PMID: 17088426 Free PMC article.
-
Differential signaling of cyclic AMP: opposing effects of exchange protein directly activated by cyclic AMP and cAMP-dependent protein kinase on protein kinase B activation.J Biol Chem. 2002 Mar 29;277(13):11497-504. doi: 10.1074/jbc.M110856200. Epub 2002 Jan 18. J Biol Chem. 2002. PMID: 11801596
-
Epac and PKA: a tale of two intracellular cAMP receptors.Acta Biochim Biophys Sin (Shanghai). 2008 Jul;40(7):651-62. doi: 10.1111/j.1745-7270.2008.00438.x. Acta Biochim Biophys Sin (Shanghai). 2008. PMID: 18604457 Free PMC article. Review.
-
Epac: new emerging cAMP-binding protein.BMB Rep. 2021 Mar;54(3):149-156. doi: 10.5483/BMBRep.2021.54.3.233. BMB Rep. 2021. PMID: 33298248 Free PMC article. Review.
Cited by
-
Monitoring biosensor activity in living cells with fluorescence lifetime imaging microscopy.Int J Mol Sci. 2012 Nov 7;13(11):14385-400. doi: 10.3390/ijms131114385. Int J Mol Sci. 2012. PMID: 23203070 Free PMC article. Review.
-
Distinct G protein-coupled receptor recycling pathways allow spatial control of downstream G protein signaling.J Cell Biol. 2016 Sep 26;214(7):797-806. doi: 10.1083/jcb.201512068. Epub 2016 Sep 19. J Cell Biol. 2016. PMID: 27646272 Free PMC article.
-
Visualizing Cyclic Adenosine Monophosphate in Cardiac Microdomains Involved in Ion Homeostasis.Front Physiol. 2019 Nov 26;10:1406. doi: 10.3389/fphys.2019.01406. eCollection 2019. Front Physiol. 2019. PMID: 31849691 Free PMC article. Review.
-
Augmented cAMP Signaling by Co-Administration of Resveratrol and Curcumin: A Cellular Biosensor Kinetic Assessment.Iran J Public Health. 2019 Jul;48(7):1310-1316. Iran J Public Health. 2019. PMID: 31497553 Free PMC article.
-
Genetically Encoded Fluorescent Biosensors Illuminate the Spatiotemporal Regulation of Signaling Networks.Chem Rev. 2018 Dec 26;118(24):11707-11794. doi: 10.1021/acs.chemrev.8b00333. Epub 2018 Dec 14. Chem Rev. 2018. PMID: 30550275 Free PMC article. Review.
References
-
- Kopperud, R., Krakstad, C., Selheim, F. & Doskeland, S. O. (2003) FEBS Lett. 546, 121–126. - PubMed
-
- Chin, K. V., Yang, W. L., Ravatn, R., Kita, T., Reitman, E., Vettori, D., Cvijic, M. E., Shin, M. & Iacono, L. (2002) Ann. N.Y. Acad. Sci. 968, 49–64. - PubMed
-
- Taylor, S. S., Yang, J., Wu, J., Haste, N. M., Radzio-Andzelm, E. & Anand, G. (2004) Biochim. Biophys. Acta 1697, 259–269. - PubMed
-
- de Rooij, J., Zwartkruis, F. J. T., Verheijen, M. H. G., Cool, R. H., Nijman, S. M. B., Wittinghofer, A. & Bos, J. L. (1998) Nature 396, 474–477. - PubMed
-
- Kawasaki, H., Springett, G. M., Mochizuki, N., Toki, S., Nakaya, M., Matsuda, M., Housman, D. E. & Graybiel, A. M. (1998) Science 282, 2275–2279. - PubMed
Publication types
MeSH terms
Substances
Grants and funding
LinkOut - more resources
Full Text Sources
Other Literature Sources
