. 2004 Nov 23;101(47):16653-8.
doi: 10.1073/pnas.0407596101. Epub 2004 Nov 15.

Identification and functional characterization of a sex pheromone receptor in the silkmoth Bombyx mori

Affiliations

Identification and functional characterization of a sex pheromone receptor in the silkmoth Bombyx mori

Takeshi Sakurai et al. Proc Natl Acad Sci U S A. .

Abstract

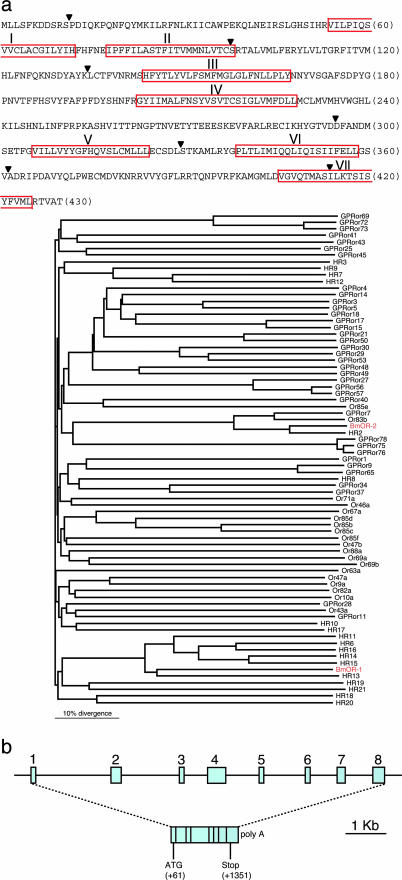
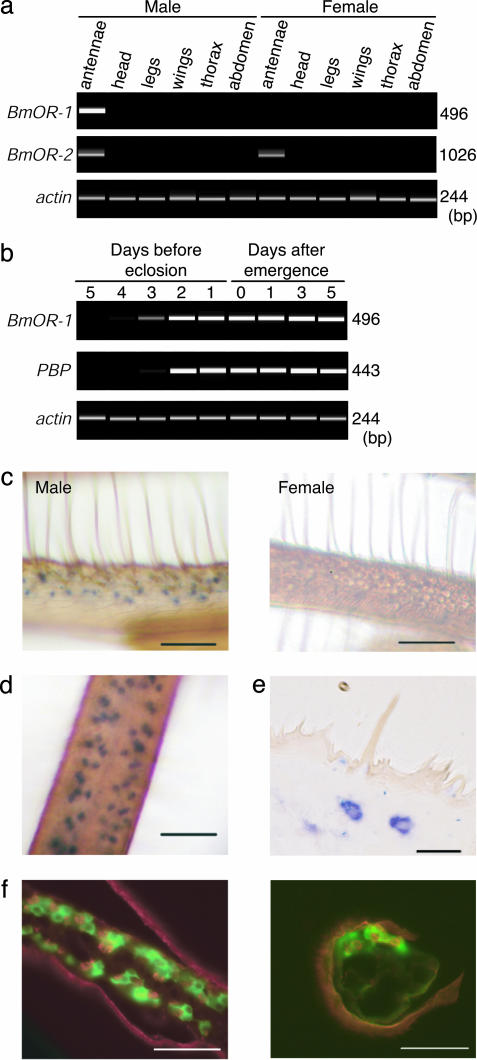
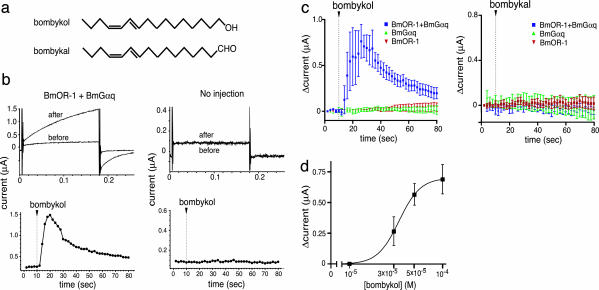
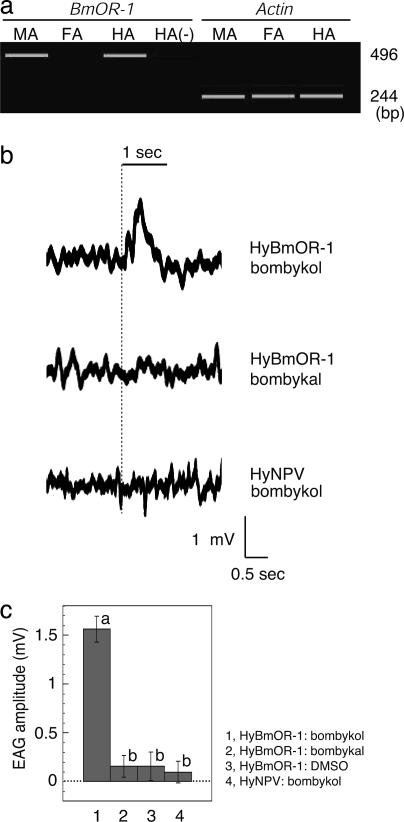
Sex pheromones released by female moths are detected with high specificity and sensitivity in the olfactory sensilla of antennae of conspecific males. Bombykol in the silkmoth Bombyx mori was the first sex pheromone to be identified. Here we identify a male-specific G protein-coupled olfactory receptor gene, B. mori olfactory receptor 1 (BmOR-1), that appears to encode a bombykol receptor. The BmOR-1 gene is located on the Z sex chromosome, has an eight-exon/seven-intron structure, and exhibits male-specific expression in the pheromone receptor neurons of male moth antenna during late pupal and adult stages. Bombykol stimulation of Xenopus laevis oocytes expressing BmOR-1 and BmGalphaq elicited robust dose-dependent inward currents on two-electrode voltage clamp recordings, demonstrating that the binding of bombykol to BmOR-1 leads to the activation of a BmGalphaq-mediated signaling cascade. Antennae of female moths infected with BmOR-1-recombinant baculovirus showed electrophysiological responses to bombykol but not to bombykal. These results provide evidence that BmOR-1 is a G protein-coupled sex pheromone receptor that recognizes bombykol.


Figures

Fig. 1.
Fig. 1.
Amino acid sequence and genomic structure of BmOR-1. (a Upper) Deduced amino acid sequence of BmOR-1. Red boxes, putative transmembrane regions predicted by sosui (http://sosui.proteome.bio.tuat.ac.jp/cgi-bin/sosui.cgi?/sosui_submit.html) and tmpred (www.ch.embnet.org/software/TMPRED_form.html). Arrowheads, intron–exon boundaries. (a Lower) Phylogenetic tree of the amino acid sequences of candidate ORs from various insect species. Protein names starting with Or, GPR, HR, and BmOR are ORs of D. melanogaster, A. gambiae, H. virescens, and B. mori, respectively. Branch lengths are proportional, and the scale of distance is indicated. BmOR names are in red type. (b) Schematic representation of the genomic structure of BmOR-1. The position and relative size of exons and introns are drawn to scale as indicated. Structure of the BmOR-1 gene and locations of start/stop codons are shown.
Fig. 2.
Fig. 2.
Expression pattern of the BmOR-1 gene. (a) Tissue- and sex-specific expression of BmOR-1, BmOR-2, and B. mori actin genes (24), a positive control. RT-PCR products by using RNA isolated from various tissues of male and female moths, as indicated, were separated by electrophoresis. (b) Developmental analysis of BmOR-1 and PBP expression in the male antennae, with the B. mori actin gene as a positive control. RT-PCR products were separated by electrophoresis. A very faint band that corresponded to BmOR-1 product was detected at 4 days before eclosion. (c) Whole-mount in situ hybridization of BmOR-1 in the antennae of male (Left) and female (Right) moths. Reactive blue cells visualized by using an anti-DIG Ab were found on the side with chemosensory hairs. (d) A whole-mount in situ section of the male antenna viewed from olfactory sensilla side. (e) Whole-mount in situ labeling of a 2-μm plastic section of the male antenna. Labeled cells were found only in the antennal surface that carries olfactory sensilla. (f) Two-color fluorescent in situ hybridization of BmOR-1 (red) and PBP (green). Double-labeling was performed for a longitudinal (Left) and cross (Right) sections of the male antenna by using DIG-labeled BmOR-1 and fluorescein-labeled PBP antisense RNA. [Scale bar: 50 μm(c, d, and f), 20 μm(e).]
Fig. 3.
Fig. 3.
Bombykol responses of Xenopus oocytes expressing BmOR-1 and BmGαq. (a) Structure of bombykol and bombykal. (b) The activation of BmOR-1 by bombykol was monitored by an increase in Ca2+-dependent Cl current. (Upper) Current traces of oocytes injected with cRNAs of BmOR-1 and BmGαq(BmOR-1 + BmGαq) or noninjected control oocytes (no injection) before and after application of 100 μM bombykol. (Lower) Time course of the response plotted as the current amplitude at the end of each depolarizing pulse. Bombykol (100 μM) was applied at the time indicated by arrowheads. The data are representative of bombykol responses in 20 X. laevis oocytes from five different animals. (c) Time course of current recordings of oocytes expressing BmOR-1 + BmGαq, or BmOR-1 and BmGαq separately. Bombykol (Left) or bombykal (Right) (100 μM) was applied at the time indicated by arrowheads. Data ± SE (n = 3–4). (d) Dose-dependent increases in amplitudes of bombykol-induced currents. Current recordings at different doses were measured on different oocytes. Currents of oocytes showing responses were averaged for each concentration: 30 μM, n = 3; 50 μM, n = 3; 100 μM, n = 9.
Fig. 4.
Fig. 4.
EAG responses of the HyBmOR-1-infected female adult antennae to bombykol. (a) Ectopic expression of BmOR-1 in day-0 female adult antennae infected with BmOR-1 recombinant baculovirus (HyBmOR-1) at 4 days before eclosion. RT-PCR products by using RNA isolated from the antennae of the moths were separated by electrophoresis. MA, male antennae; FA, female antennae; HA, HyBmOR-1-infected female antennae. Minus sign indicates RT-PCR was performed without reverse transcriptase. (b) EAG recordings of HyBmOR-1- or HyNPV-infected female antennae exposed to bombykol or bombykal at 500 ml/min. EAG traces of the same HyBmOR-1-infected female antenna to bombykol (Top) or bombykal (Middle) are shown. Stimulus was applied starting at the time indicated by the dotted line for the duration of 1 s, as indicated by the solid line above the recording profiles. In these recordings, a reference electrode was placed at the tip of antenna, and thereby, the response was shown as a positive signal. (c) Quantitative analysis of EAG responses of HyBmOR-1-infected female antennae to bombykol. Amplitudes of responses of HyBmOR-1-infected female antennae to bombykol (lane 1) or bombykal (lane 2) (4 μg on filter paper) or to 1% DMSO as a control (lane 3) with a flow rate of 350 ml/min (n = 10 each) were quantified. EAG recordings to these three stimuli were measured on the same antenna. WT HyNPV was used as a negative control (lane 4) (n = 25). Error bars represent ± SEM. Average values marked by different letters are significantly different (Scheffé's test: P < 0.05). The EAG response of HyBmOR-1 to bombykol (lane 1) was significantly larger than to bombykal (lane 2) or DMSO (lane 3). The other three responses (lanes 2–4) were not significantly different.

References

    1. Karlson, P. & Lüscher, M. (1959) Nature 183, 55–56. - PubMed
    1. Butenandt, V. A., Beckmann, R., Stamm, D. & Hecker, E. (1959) Z. Naturforsch. 14, 283–284.
    1. Schneider, D. (1969) Science 163, 1031–1037. - PubMed
    1. Kaissling, K.-E. (1987) R. H. Wright Lectures on Insect Olfaction, ed. Colbow, K. (Simon Fraser Univ., Burnaby, Canada).
    1. Kaissling, K.-E. & Kasang, G. (1978) Naturwissenschaften 65, 382–384.

Publication types

MeSH terms

Associated data

LinkOut - more resources