

doi: 10.1101/gad.308904.
Notch3 is required for arterial identity and maturation of vascular smooth muscle cells
Affiliations
- PMID: 15545631
- PMCID: PMC528893
- DOI: 10.1101/gad.308904
Item in Clipboard
Notch3 is required for arterial identity and maturation of vascular smooth muscle cells
Genes Dev.
.
Abstract
Formation of a fully functional artery proceeds through a multistep process. Here we show that Notch3 is required to generate functional arteries in mice by regulating arterial differentiation and maturation of vascular smooth muscle cells (vSMC). In adult Notch3-/- mice distal arteries exhibit structural defects and arterial myogenic responses are defective. The postnatal maturation stage of vSMC is deficient in Notch3-/- mice. We further show that Notch3 is required for arterial specification of vSMC but not of endothelial cells. Our data reveal Notch3 to be the first cell-autonomous regulator of arterial differentiation and maturation of vSMC.
Figures
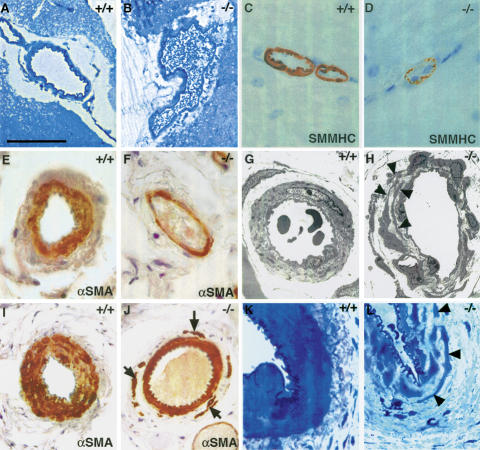
Arterial defects in adult Notch3–/– mice. (A–D) Cerebral arteries from wild-type and Notch3–/– mice. Toluidine blue staining of semithin sections (A,B) shows that the Notch3–/– artery is enlarged; SMMHC staining (C,D) shows the thinner profile of Notch3–/– vSMC. (E–H) Tail lateral arteries. αSMA staining (E,F) shows that the Notch3–/– artery is enlarged and has a thinner vSMC coat; electron micrographs (G,H) show the marked alteration in the shape and size of vSMC in Notch3–/– mice. Arrowheads point to the thin elongated cell processes from distinct vSMC that overlap. (I–L) Caudal arteries. αSMA staining (I,J) shows the disorganized tunica media in Notch3–/– artery with noncohesive vSMC in the outermost layers (arrows); toluidine blue staining of semithin sections (K,L) shows the thinner and irregular profiles of mutant vSMC. Bars: A,B,I,J, 85 μm; C–F,K,L, 34 μm; G, 8 μm; H, 14 μm.
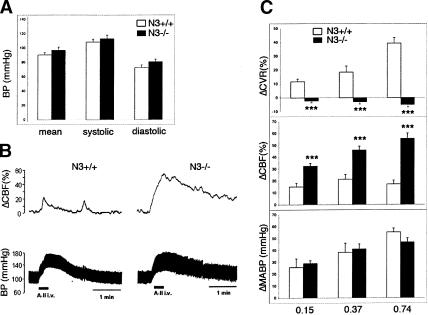
Impaired cerebral blood flow reactivity in Notch3–/– mice. (A) Arterial blood pressure measurements in conscious wild-type (open bars, n = 8) and Notch3–/– mice (filled bars, n = 8; 5–7 mo old). Mean values ± SEM of systolic, diastolic, and mean arterial pressure (MABP) do not differ between wild-type and mutant mice. (B) Representative blood pressure (lower) and CBF (upper) tracings from wild-type (left) and mutant (right) mice in response to angiotensin II injection. (C) The effects on MABP (in millimeter Hg change, lower panel), on CBF (in percent change, middle panel), and CVR (in percent change, upper panel) were measured in response to three distinct doses of angiotensin II (0.15, 0.37, and 0.74 μg/kg) in wild-type mice (open bars, n = 6) and mutant mice (filled bars, n = 6). Angiotensin II infusion induces similar blood pressure response in wild-type and mutant mice but strongly defective CBF and CVR responses in Notch3–/– mice. Bars represent the mean ± SEM. Statistical analysis was carried out using the unpaired Student's t-test. (*** P < 0.001).
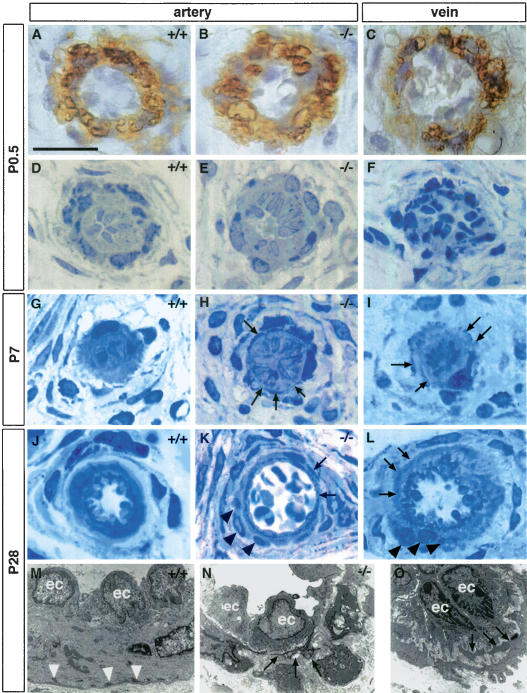
Impaired postnatal maturation of the lateral arteries from the tail in Notch3–/– mice. (A–C) α-SMA staining of P0.5 arteries from wild-type (A) and Notch3–/– mice (B) and vein from wild-type mice (C) showing that arteries and veins are surrounded by α-SMA-positive mural cells. (D–L) Toluidine blue staining of semithin sections at P0.5 (D–F), P7 (G–I), and P28 (J–L) from wild-type arteries (D,G,J), Notch3–/– arteries (E,H,K), and wild-type veins (F,I,L). At P0.5 wild-type and Notch3–/– arteries and wild-type vein appear similar. At later stages, vSMC in wild-type arteries harmoniously increase in length and thickness and become circumferentially oriented around the lumen, while vSMC in Notch3–/– arteries exhibit thin, irregular, and overlapping cytoplasmic processes (arrows), and form abnormal clusters of poorly oriented cells (black arrowheads). Note the similar aspect of vSMC from veins to those from Notch3–/– arteries at the same age. (M–O) Electron micrographs at P28 of wild-type artery (M), Notch3–/– artery (N), and wild-type vein (O), showing the irregular shape of vSMC with thin cytoplasmic expansions as well as the marked reduction of dense plaques (white arrowheads) in the mutant artery and the wild-type vein (ec, endothelial cells). Bars: A–L, 17 μm; M, 7.5 μm; N, 10 μm; O, 5 μm.
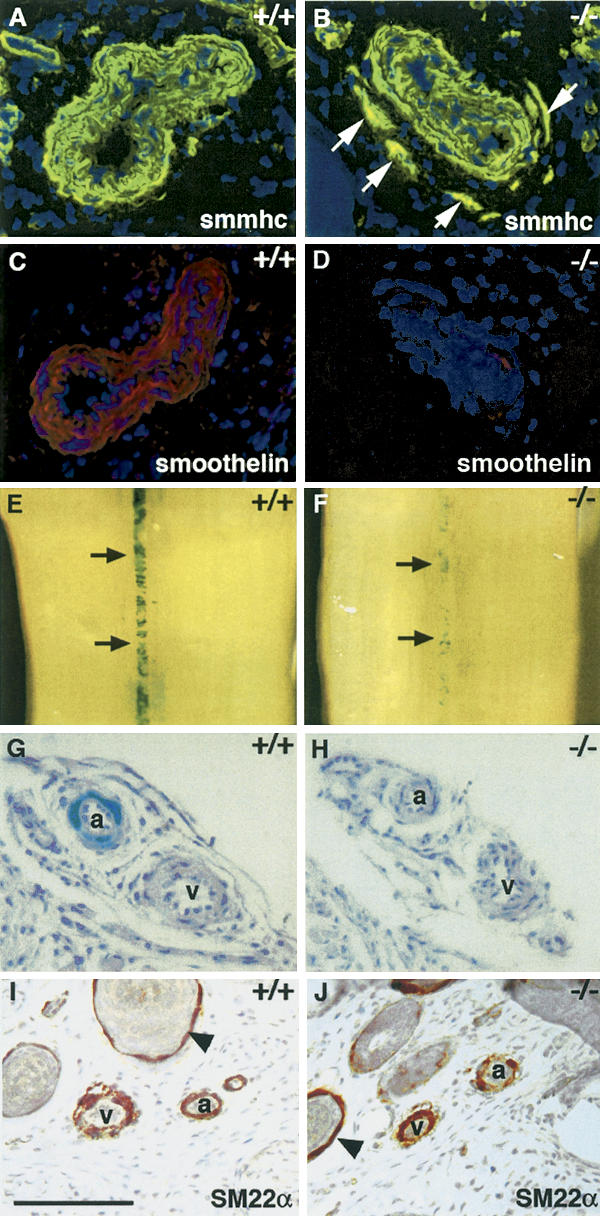
Expression of arterial markers of smooth muscle cells is impaired in Notch3–/– mice. SMMHC (A,B) and smoothelin (C,D) staining of wild-type and Notch3–/– caudal arteries. Notch3–/– arteries exhibit normal SMMHC expression levels but markedly reduced smoothelin expression levels. White arrows point to the ectopic vSMC stained with SMMHC in the mutant artery. (E–H) β-Gal staining of tails from Notch3+/+ and Notch3–/– mice heterozygous for the SM22α–LacZ transgene. Macroscopic view of caudal artery (E,F, black arrows) and microscopic view through artery (a) and vein (v) in a lateral bundle (G,H) showing that β-gal staining is restricted to arterial vSMC in control mice and is markedly reduced in mutant arteries. (I,J) SM22α staining of Notch3+/+ and Notch3–/– tail sections. SM22α is expressed in arterial, venous, and visceral (arrowheads) smooth muscle cells in both control and Notch3–/– mice. Mice shown in panels A–D were P28 and those in panels E–J were P7. Bars: A–D,G–J, 85 μm; E,F, 560 μm.
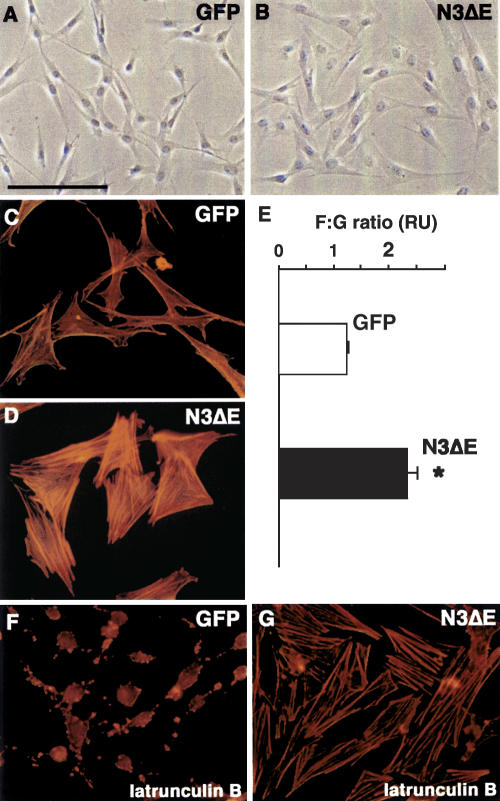
Activated Notch3 modulates cell shape and actin dynamics in cultured vSMC. (A,B) Cells expressing an activated Notch3 construct (N3ΔE) have a markedly different morphological appearance compared to GFP-expressing cells, being larger and having a less elongated shape. (C,D) N3ΔE cells exhibit a more robust actin stress fibers network compared to GFP cells. (E) The F:G actin ratio is increased in N3ΔE-expressing cells. *P < 0.05 compared with GFP cells. Results are mean ± SEM of three independent experiments performed in triplicate. (F,G) GFP cells are latrunculin B sensitive, with marked actin cytoskeleton disassembly, while N3ΔE cells have higher latrunculin B resistance. Bars: A,B, 135 μm; C,D,F,G, 69 μm.
References
-
- Artavanis-Tsakonas S., Rand, M.D., and Lake, R.J. 1999. Notch signaling: Cell fate control and signal integration in development. Science 284: 770-776. - PubMed
-
- Berrou E. and Bryckaert, M. 2001. Platelet-derived growth factor inhibits smooth muscle cell adhesion to fibronectin by ERK-dependent and ERK-independent pathways. J. Biol. Chem. 276: 39303-39309. - PubMed
-
- Bonvento G., Charbonne, R., Correze, J.L., Borredon, J., Seylaz, J., and Lacombe, P. 1994. Is α-chloralose plus halothane induction a suitable anesthetic regimen for cerebrovascular research? Brain Res. 665: 213-221. - PubMed
-
- Carmeliet P. 2003. Angiogenesis in health and disease. Nat. Med. 9: 653-660. - PubMed
Publication types
MeSH terms
Substances
Grants and funding
LinkOut - more resources
Full Text Sources
Other Literature Sources
Molecular Biology Databases
Miscellaneous