. 2004 Nov 15;18(22):2747-63.
doi: 10.1101/gad.313104.

c-Myc controls the balance between hematopoietic stem cell self-renewal and differentiation

Affiliations

c-Myc controls the balance between hematopoietic stem cell self-renewal and differentiation

Anne Wilson et al. Genes Dev. .

Abstract

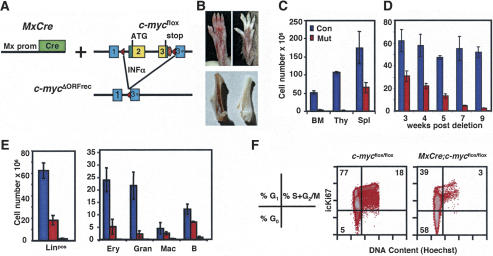
The activity of adult stem cells is essential to replenish mature cells constantly lost due to normal tissue turnover. By a poorly understood mechanism, stem cells are maintained through self-renewal while concomitantly producing differentiated progeny. Here, we provide genetic evidence for an unexpected function of the c-Myc protein in the homeostasis of hematopoietic stem cells (HSCs). Conditional elimination of c-Myc activity in the bone marrow (BM) results in severe cytopenia and accumulation of HSCs in situ. Mutant HSCs self-renew and accumulate due to their failure to initiate normal stem cell differentiation. Impaired differentiation of c-Myc-deficient HSCs is linked to their localization in the differentiation preventative BM niche environment, and correlates with up-regulation of N-cadherin and a number of adhesion receptors, suggesting that release of HSCs from the stem cell niche requires c-Myc activity. Accordingly, enforced c-Myc expression in HSCs represses N-cadherin and integrins leading to loss of self-renewal activity at the expense of differentiation. Endogenous c-Myc is differentially expressed and induced upon differentiation of long-term HSCs. Collectively, our data indicate that c-Myc controls the balance between stem cell self-renewal and differentiation, presumably by regulating the interaction between HSCs and their niche.


Figures

Figure 1.
Figure 1.
Induced deletion of c-myc in the adult bone marrow results in severe cytopenia and a decrease in proliferation of differentiated progenitors. (A) MxCre-mediated conversion of the c-mycflox allele into the c-mycΔORFrec allele by deletion of DNA between the two loxP sites in the c-mycflox locus. This includes the entire c-myc ORF (yellow). Exons 1–3 are indicated. (Red triangles) loxP sites. Cre expression is induced by INFα or pI–pC. (B) Hind-paws (top) and femurs (bottom) of control (left) and MxCre;c-mycflox/flox (right) mice 8 wk after pI–pC injection. (C) Cellularity of control (blue) and mutant (red) lymphoid organs 8 wk after deletion. (BM) Bone marrow; (Thy) thymus; (Spl) spleen. Results are mean ± SD from 12 (control) and 15 (mutant) mice. (D) Kinetics of BM cellularity from 3 to 9 wk after c-myc deletion. (E) Quantitation of linpos (left) BM cells and BM subsets (right) in controls (blue) and mutants at 3 wk (red) or 8 wk (orange) post-deletion. Between three and 12 mice were analyzed at each time point. (F) Cell cycle analysis of linpos BM cells. Total BM was surface stained to define the linpos subset, then fixed, permeabilized, and stained with Hoechst 33342 and Ki-67 (icKi67) for FACS analysis. Different cell cycle phases are indicated on the left.
Figure 2.
Figure 2.
Accumulation of hematopoietic stem cells (HSC) in c-Myc-deficient BM. (A) Quantitation of the linneg population in control (blue) and mutant BM either 3 wk (red) or 8 wk (orange) post-deletion. Results are mean ± SD of 12 (control) or six (mutant) mice. (B) BM was stained for lineage markers, gated on the linneg subset, and further stained for c-Kit (CD117) and Sca-1. Numbers on the plot are the frequency of cells in the indicated regions. Hematopoietic stem cells are contained within the c-Kit+ linneg Sca-1+ (KLS cells) population. Control (left) and mutant (right). An unusual linneg, c-Kitlow, Sca-1low population (which is also CD45+, IL-7Rneg, CD135neg and expressing high levels of the integrins α2, α4, β1, and β2) appears in the mutants (data not shown). Despite extensive analysis, this population does not correspond to any characterized cell type. (C) c-Kit (CD117) vs. CD135 (Flk2/Flt3R) expression on linneg Sca-1+ BM. Numbers on the plot are the frequency of cells in the indicated (c-Kit+ linneg Sca-1+) regions. Control (left) and mutant (right). (D) CD117 vs. CD90 (Thy1) expression linneg Sca-1+ BM. (E) Total number of KLS cells per two femurs 3, 4, and 5 wk post-c-myc-deletion in control (blue) and mutant (red) BM. Results are mean ± SD of five mice per time point. (F) Number of KLSF (KLS Flk2 cells) 3 wk post-deletion. Results are mean ± SD of three mice each. (G) Cell cycle analysis of KLS cells. Cells were stained with Hoechst 33342 and Ki67 (icKi67) and analyzed by FACS. The different cell cycle phases are indicated in the scheme at the left. Numbers are the proportion of cells in each phase. (H) In vivo BrdU-labeling kinetics of KLSF-HSCs isolated from control (blue) and mutant (red) mice 3–4 wk post-deletion of c-myc. Results are mean ± SD from three mice of each genotype per time point.
Figure 3.
Figure 3.
Differentiation potential of c-Myc-deficient HSCs in vivo or in vitro. (A) The development of HSCs in vivo was determined by injecting control or mutant CD45.2+ BM cells into groups of lethally irradiated wild-type CD45.1+ host mice together with competing wild-type CD45.1+ BM cells. (Left) After 2 mo, splenocytes were analyzed by flow cytometry for the contribution of each donor population by expression of CD45.1 and CD45.2. The presence of differentiated cell types (granulocytes, Gr1+; and B lymphocytes, B220+) derived from CD45.2+ donor cells (control, blue; and mutant, red) was quantitated. (Right) Results are mean ± SD from five mice per group. (B) The Sca-1/CD117 phenotype of Linneg CD45.2+ BM in control and mutant chimeras 2 mo post-reconstitution. While the majority of mutant cells show a KLS-HSC phenotype, they often express slightly reduced levels of c-Kit (see also Fig. 2B). (C) Number of different HSC and progenitor subsets derived from CD45.2+ Linneg donor cells in the chimeras shown in A and B, and defined as CD117+Sca1neg (CMPs), CD117loSca1loCD127+ (CLPs), CD117+Sca1+CD4loCD11blo (MPPs), CD117+Sca1+CD11blo (ST-HSCs), and CD117+Sca1+CD11b (LT-HSCs) (Weissman 2000). Mutant donor BM 3 wk post-deletion contains twofold more KLS cells compared with control BM (Fig. 2E); therefore, the net increase in HSCs is about half that indicated. (D) Differentiation potential of KLS cells in vitro. FACS sorted KLS cells from control (left) and mutant (right) BM were isolated and grown in stem cell medium containing a cytokine cocktail including mSCF, mTPO, mFlt3L, IL-6, IL-7, Il-11, GM-CSF, and EPO. After 7 d, cultures were photographed using phase contrast. FACS analysis of expression of lineage markers on bulk cultured KLS cells. (Top) Gr-1 (granulocytes) versus CD11b (macrophages). (Bottom) B220 (B lymphocytes) (control, blue; mutant, red). Numbers on plots are the proportion of cells in indicated regions. (E) Genotyping by PCR of cultured control (C) and mutant (M) cells from D after 7 d. Control cells were positive for the c-mycflox allele (flox) and the DNA control (18s), whereas the mutant (M) cells were negative for the c-mycflox allele (flox), but positive for the c-mycΔORF/rec (Δ) allele as expected. (F, left) In vitro differentiation of purified KLS cells. LinnegCD117+Sca1+ BM cells were FACS sorted from control and c-Myc-deficient mice and cultured for 9 d after transfection with either MYC–IRES–huCD2 or huCD2 control viruses. Expression of mature hematopoietic cell markers (Gr1, CD11b, Ter119, and CD19) is shown on huCD2+ cells in control (huCD2 alone virus in control cells, dark-blue line), c-Myc-deficient cells transfected with the huCD2 control virus (solid red histogram), or c-Myc-deficient cells transfected with the MYC–IRES–huCD2 virus (light-blue line). (Right) Expansion of c-Myc-deficient (KO) or control (C) KLS-HSC cultures 9 d after infection with the huCD2 control virus or with the MYC–IRES–huCD2 virus (c-MYC). Data is expressed as fold increase over input cell number. This is a representative example of one of two experiments giving similar results.
Figure 7.
Figure 7.
(A) Model for the regulation of HSC fate by c-Myc-controlled adhesion to the stem cell niche. (Top) A quiescent HSC expressing low c-Myc levels is retained in the stem cell niche consisting of spindle-shaped N-cadherin+ osteoblasts (SNO) (Zhang et al. 2003) embedded in stromal fibroblasts. HSCs are anchored to SNO cells via homotypic N-cadherin and LFA-1/ICAM interaction. In addition, expression of α2β1-integrin and α5β1-integrin connects HSCs to the specialized extracellular matrix (ECM) in the niche. In response to mitogenic signals, HSCs enter the cell cycle and generate two daughter cells. (a) In the absence of c-Myc-induction integrins and other putative cell-adhesion molecules remain highly expressed in both daughter cells retaining them in the niche, thereby promoting expansion of HSCs at the expense of differentiation. (b) Induction of c-Myc in only one of the daughter cells causes down-regulation of cell-adhesion molecules and generates asymmetry with one HSC retained in the niche and one leaving the niche, promoting differentiation into committed progenitors (CP). In this homeostatic situation, the stem cell pool is maintained while differentiated progeny are produced. (c) High c-Myc expression in both daughter cells (e.g., ectopic c-MYC expression in HSCs) results in repression of cell-adhesion molecules and departure of both cells from the niche. This leads to the production of two CPs and hence progressive exhaustion of the stem cell pool due to differentiation. (B) Model for the regulation of hematopoiesis by c-Myc. (a) The wild-type (WT) hematopoietic system. Under homeostatic conditions, long-term hematopoietic stem cells (LT-HSCs) express low levels of c-Myc, ensuring self-renewal. In a subset of LT-HSCs, c-Myc expression increases, inducing differentiation toward a short-term hematopoietic stem cell (ST-HSC) fate. Continued differentiation leads to the loss of self-renewal activity, and early progenitor cells of different hematopoietic cell types become transient-amplifying cells (TA-cells), which rapidly expand through proliferation while continuing to differentiate into more and more lineage-restricted progenitors. High c-Myc levels are maintained in TA-cells, ensuring continued cell cycle progression. At the onset of terminal differentiation, c-Myc is down-regulated to allow permanent cell cycle exit and progression toward terminal differentiation. (b) Induced elimination of c-Myc in the fully developed adult hematopoietic system results in two distinct effects. First, TA-cells (progenitors) stop expanding, as c-Myc is required to maintain cells in an active cell cycle. Second, c-Myc-deficient LT-HCSs self-renew, but fail to initiate normal differentiation, leading to their accumulation as long as niche space is available. Together, this leads to loss of all hematopoietic cell types with the exception of HSCs. (c) Enforced expression of c-Myc in LT-HSCs promotes differentiation at the expense of self-renewal, resulting in stem cell exhaustion. In the absence of stem cell activity, all hematopoietic cell types are lost over time due to normal cellular turnover.
Figure 4.
Figure 4.
Localization of precursors in the N-cadherin-expressing bone marrow stem cell niche. Linneg precursors from control (Co) and c-Myc-deficient (Mu) BM were stained with CFSE (green, *) and i.v. injected into sub-lethally irradiated wild-type mice. (A) Trabecular bone sections are stained with DAPI (blue) and anti-osteopontin (panels 1,2, red) or anti-BMPRIα (panels 3,4, red) to visualize osteoblasts. White lines trace the edge of the endosteum. Yellow arrowheads denote osteopontin deposits. (BM) bone marrow (B, middle row) Trabecular bone sections are stained with anti-N-cadherin (red) to visualize SNO-cells (spindle-shaped N-cadherin+ osteoblasts) in the niche. (Bo) Bone; (En) endosteum. White lines trace the edge of the endosteum. Arrowheads denote CFSE+ cells (green). (Bottom row) Images were merged using Adobe Photoshop software. (Panels 1–3) Control precursors localized at the N-cadherin+ endosteum. (Panels 4–6) Control cell with low expression of N-cadherin localized in the center of the bone marrow. (Panels 7–12) Two frames showing c-Myc-deficient precursor cells expressing high levels of N-cadherin localized to the N-cadherin+ endosteum. (Panels 12–15) Two CFSE+ mutant precursor cells attached to the N-cadherin+ endosteum. Whereas the cell at the top expresses N-cadherin only at low levels, the cell at the bottom (panels 14,15,and inset in panel 15) expresses high levels of N-cadherin and is in direct contact with a SNO-cell.
Figure 5.
Figure 5.
Up-regulation of N-cadherin and several integrins on c-Myc-deficient HSCs. Expression of N-cadherin on c-Myc-deficient KLS-HSCs as determined by FACS. (A, filled histogram) c-Myc-deficient KLS-HSCs; (solid line overlay) control KLS-HSCs; (dotted line overlay) negative control (omission of N-cadherin antibody). Horizontal arrow indicates positive N-cadherin staining. (B) Up-regulation of LFA-1 (αLβ2 integrin), α5and β1 integrins on c-Myc-deficient KLS-HSCs. Histogram analysis of CD11a (αL integrin), CD18 (β2 integrin), CD29 (β1 integrin), CD49d (α4 integrin), CD49b (α2 integrin), CD49e (α5 integrin), CD62L (L-selectin), and CXCR4. (Filled histogram) Mutants; (overlaid line) control.
Figure 6.
Figure 6.
Down-regulation of N-cadherin expression in response to ectopic expression of c-MYC. (A) Wild-type linneg BM infected with MYC–IRES–huCD2 virus (c-MYC overexpression, filled histogram) or huCD2 control virus (wild-type, solid line). Dotted overlay shows a negative control-omitting N-cadherin antibody. Histograms are gated on huCD2+ linneg Sca-1+ cells after 4 d in culture. (B) Integrin expression in response to ectopic expression of c-MYC. Wild-type linneg cells were isolated by flow cytometry and either infected with MYC–IRES–huCD2 (filled histogram), or huCD2 control virus (overlaid line). After 7 d, cells were harvested and the huCD2+ linneg subset analyzed for expression of indicated integrins by FACS. (C) Ectopic expression of c-MYC in vivo. Wild-type Linneg BM, highly enriched for KLS-HSCs, was isolated and infected as in A and B. c-MYC overexpression (MYC–IRES–huCD2) (dotted lines), or control expressing huCD2 alone (solid lines). Infected BM was transferred together with wild-type BM into lethally irradiated recipients to generate mixed BM chimeras. At times indicated, the percent huCD2+ cells in donor phenotype PBLs or BM was assessed by FACS analysis. Each line represents data from an individual mouse. (D) Percent huCD2+ cells in KLSF cells after BM reconstitution in vivo as in C, except that starting linneg BM cells were obtained from H2K–BCL-2 transgenic mice in which HSCs express BCL-2. Control chimeras (BCL-2) and c-MYC overexpression chimeras (c-MYC/BCL-2). Results shown are from three (BCL-2) and four (c-Myc/BCL-2) mice.

Similar articles

Cited by

References

    1. Adolfsson J., Borge, O.J., Bryder, D., Theilgaard-Monch, K., Astrand-Grundstrom, I., Sitnicka, E., Sasaki, Y., and Jacobsen, S.E. 2001. Upregulation of Flt3 expression within the bone marrow Lin(–)Sca1(+)c-kit(+) stem cell compartment is accompanied by loss of self-renewal capacity. Immunity 15: 659-669. - PubMed
    1. Akashi K., Kondo, M., Cheshier, S., Shizuru, J., Gandy, K., Domen, J., Mebius, R., Traver, D., and Weissman, I.L. 1999. Lymphoid development from stem cells and the common lymphocyte progenitors. Cold Spring Harb. Symp. Quant. Biol. 64: 1-12. - PubMed
    1. Akashi K., Traver, D., Miyamoto, T., and Weissman, I.L. 2000. A clonogenic common myeloid progenitor that gives rise to all myeloid lineages. Nature 404: 193-197. - PubMed
    1. Amati B., Alevizopoulos, K., and Vlach, J. 1998. Myc and the cell cycle. Front. Biosci. 3: D250-D268. - PubMed
    1. Arai F., Hirao, A., Ohmura, M., Sato, H., Matsuoka, S., Takubo, K., Ito, K., Koh, G.Y., and Suda, T. 2004. Tie2/angiopoietin-1 signaling regulates hematopoietic stem cell quiescence in the bone marrow niche. Cell 118: 149-161. - PubMed

Publication types

MeSH terms