

Estimation of long-term effective population sizes through the history of durum wheat using microsatellite data
- PMID: 15545658
- PMCID: PMC1449565
- DOI: 10.1534/genetics.104.029553
Estimation of long-term effective population sizes through the history of durum wheat using microsatellite data
Abstract
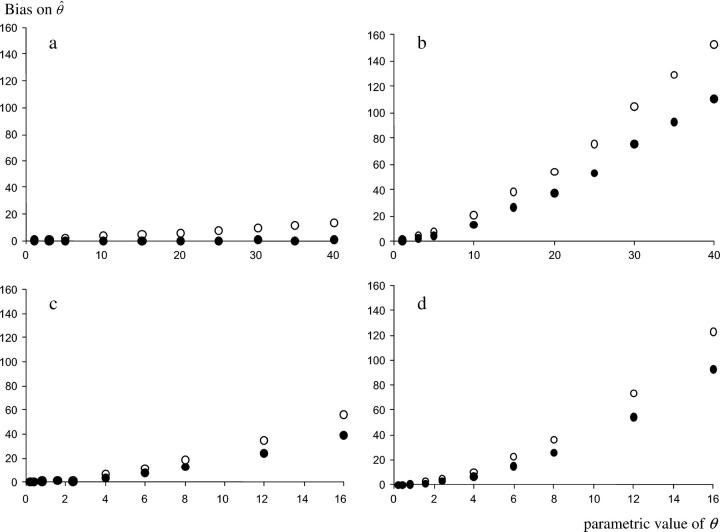
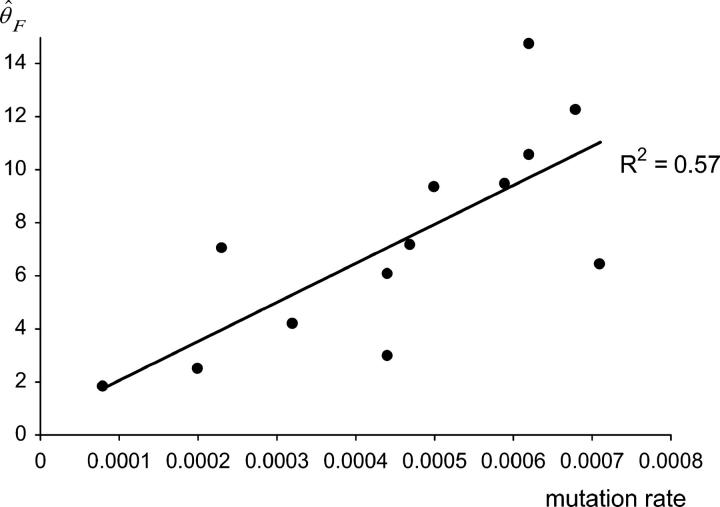
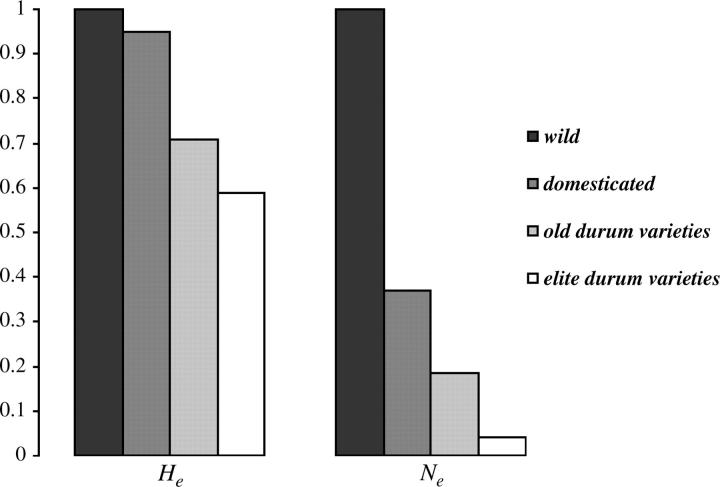
Estimation of long-term effective population size (N(e)) from polymorphism data alone requires an independent knowledge of mutation rate. Microsatellites provide the opportunity to estimate N(e) because their high mutation rate can be estimated from observed mutations. We used this property to estimate N(e) in allotetraploid wheat Triticum turgidum at four stages of its history since its domestication. We estimated the mutation rate of 30 microsatellite loci. Allele-specific mutation rates mu were predicted from the number of repeats of the alleles. Effective population sizes were calculated from the diversity parameter theta = 4N(e)mu. We demonstrated from simulations that the unbiased estimator of theta based on Nei's heterozygosity is the most appropriate for estimating N(e) because of a small variance and a relative robustness to variations in the mutation model compared to other estimators. We found a N(e) of 32,500 individuals with a 95% confidence interval of [20,739; 45,991] in the wild ancestor of wheat, 12,000 ([5790; 19,300]) in the domesticated form, 6000 ([2831; 9556]) in landraces, and 1300 ([689; 2031]) in recent improved varieties. This decrease illustrates the successive bottlenecks in durum wheat. No selective effect was detected on our loci, despite a complete loss of polymorphism for two of them.
Figures
References
-
- Brodehe, J., A. P. Møller and H. Ellegren, 2004. Individual variation in microsatellite mutation rate in barn swallows. Mutat. Res. 545: 73–80. - PubMed
-
- Buckler, IV, E. S., J. M. Thornsberry and S. Kresovich, 2001. Molecular diversity, structure and domestication of grasses. Genet. Res. 77: 213–218. - PubMed
-
- Casella, G., and R. L. Berger, 1990 Statistical Inference. Duxbury Press, Belmont, CA.
Publication types
MeSH terms
Substances
Associated data
- Actions
- Actions
- Actions
- Actions
- Actions
- Actions
- Actions
- Actions
- Actions
- Actions
- Actions
- Actions
- Actions
- Actions
- Actions
- Actions
- Actions
- Actions
- Actions
- Actions
- Actions
- Actions
- Actions
- Actions
- Actions
- Actions
- Actions
- Actions
LinkOut - more resources
Full Text Sources
Research Materials
