Comparative Study
. 2004 Nov;114(10):1444-56.
doi: 10.1172/JCI21689.

A role for proteinase-activated receptor-1 in inflammatory bowel diseases

Affiliations
Comparative Study

A role for proteinase-activated receptor-1 in inflammatory bowel diseases

Nathalie Vergnolle et al. J Clin Invest. 2004 Nov.

Retraction in

  • A role for proteinase-activated receptor-1 in inflammatory bowel diseases.
    Vergnolle N, Cellars L, Mencarelli A, Rizzo G, Swaminathan S, Beck P, Steinhoff M, Andrade-Gordon P, Bunnett NW, Hollenberg MD, Wallace JL, Cirino G, Fiorucci S. Vergnolle N, et al. J Clin Invest. 2006 Jul;116(7):2056. doi: 10.1172/jci21689r1. J Clin Invest. 2006. PMID: 16881139 Free PMC article. No abstract available.

Abstract

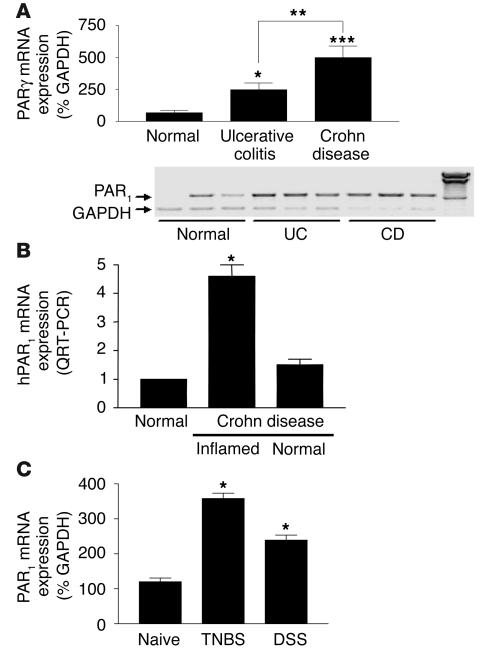
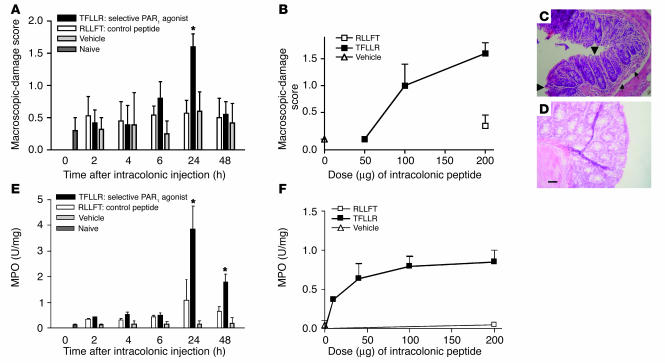
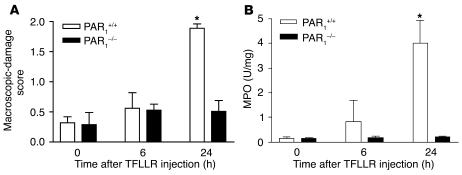
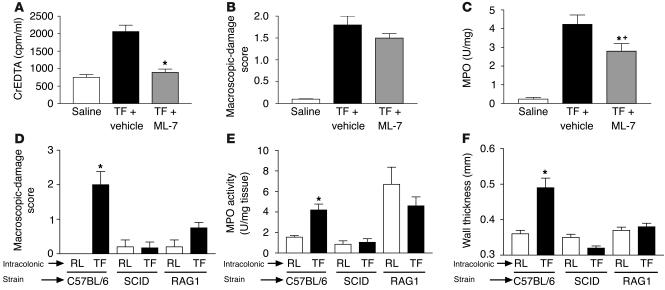
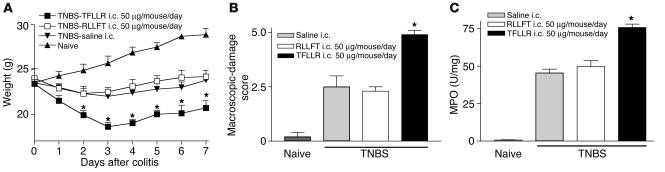
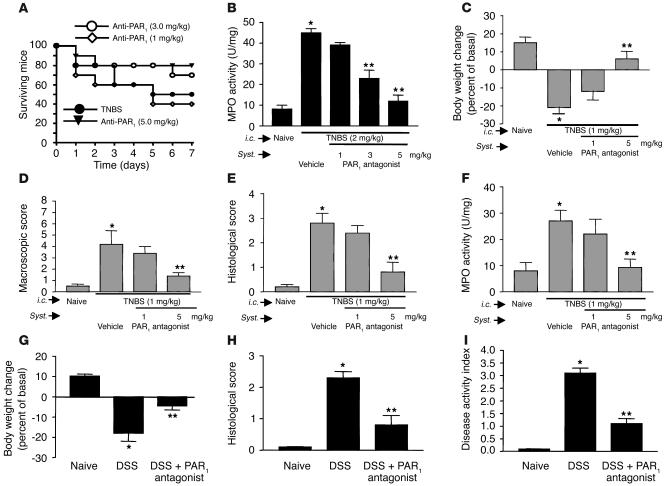
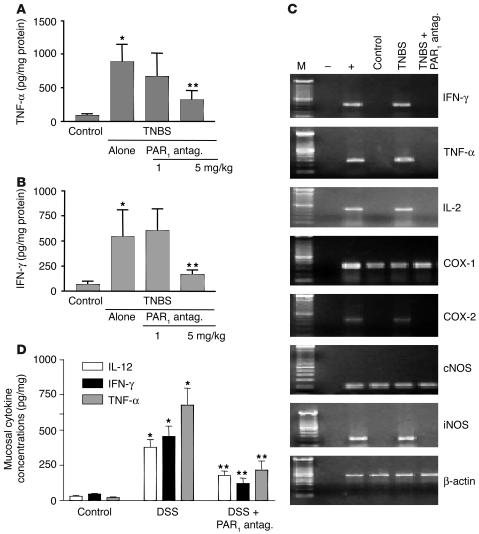
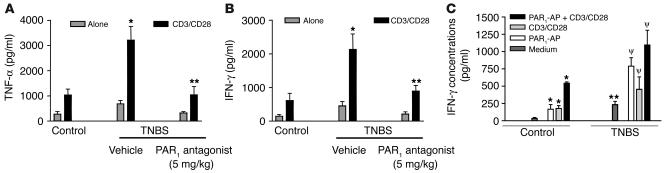
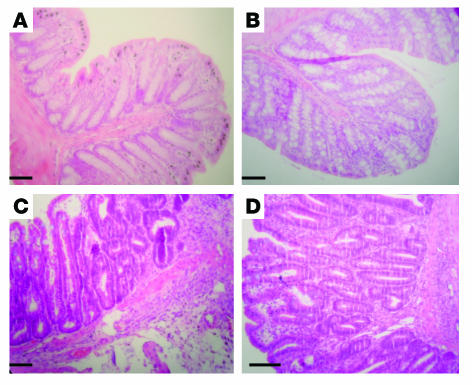
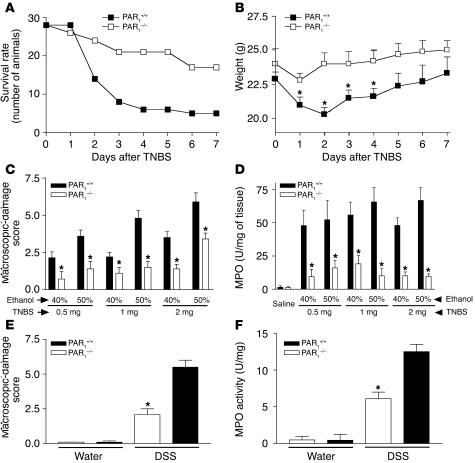
Proteinase-activated receptor-1 (PAR1), a G protein-coupled receptor activated by thrombin, is highly expressed in different cell types of the gastrointestinal tract. The activity of thrombin and of other proteinases is significantly increased in the colon of inflammatory bowel disease (IBD) patients. Since PAR1 activation in tissues other than the gut provoked inflammation, we hypothesized that PAR1 activation in the colon is involved in the pathogenesis of IBD. Here, we demonstrate that PAR1 is overexpressed in the colon of IBD patients. In mice, intracolonic administration of PAR1 agonists led to an inflammatory reaction characterized by edema and granulocyte infiltration. This PAR1 activation-induced inflammation was dependent on B and T lymphocytes. Moreover, PAR1 activation exacerbated and prolonged inflammation in a mouse model of IBD induced by the intracolonic administration of trinitrobenzene sulfonic acid (TNBS), while PAR1 antagonism significantly decreased the mortality and severity of colonic inflammation induced by TNBS and dextran sodium sulfate. In these 2 models, colitis development was strongly attenuated by PAR1 deficiency. Taken together, these results imply an important role for PAR1 in the pathogenesis of experimental colitis, supporting the notion that PAR1 inhibition may be beneficial in the context of IBD and possibly in other chronic intestinal inflammatory disorders.


Figures

Figure 1
Figure 1
PAR1 mRNA detection in humans and mice. (A and B) PAR1 mRNA detection in colonic biopsies from control (normal), ulcerative colitis (UC), or Crohn disease (CD) patients, by RT-PCR (A) and real-time RT-PCR (B). A minimum of 5 patients per group was considered for quantification, and representative RT-PCR for 3 patients per group is shown (blots). hPAR1, human PAR1. (C) PAR1 mRNA detection in colonic tissues from naive mice or mice with TNBS- or DSS-induced colitis. PAR1 mRNA detection was assessed by the amplification of a specific PCR fragment and was expressed as percentage of amplified GAPDH fragment. For quantification, values are mean ± SEM; n = 5 per group. *P < 0.05, **P < 0.01, ***P < 0.001.
Figure 2
Figure 2
Immunohistolocalization of PAR1 protein expression in the muscularis mucosae of human colon (AD) and in whole colonic tissues from naive mice (E) and mice with TNBS-induced colitis (FH). (A) Human biopsy section obtained from a macroscopically normal colon resected from a patient diagnosed with Crohn disease. PAR1 immunoreactivity was observed in vessels (arrows) and smooth muscle cells (arrowhead) (original magnification, ×100). (B) The same tissue incubated with a blocking peptide for the anti-PAR1 antibody (original magnification, ×100). PAR1 staining on the vessel was inhibited (arrow). (C) Tissues of the same patient collected in a macroscopically inflamed area, showing extensive necrosis and inflammatory infiltration of lamina propria by lymphomonocytic cells (inset) and PAR1-positive vessels (arrow). (D) A higher magnification (×400) of the vessel shown in C (arrows). Infiltrated inflammatory cells were observed in the lumen of the blood vessel. (E) Colonic tissues from naive mice, where PAR1 was expressed mainly on the epithelium (arrows). (F) Colonic tissues from TNBS-treated mice, with large tissue disruption, mucosal erosions (arrows), and PAR1 staining in infiltrated cells of the lamina propria (arrowheads) as well as epithelium. (G) The PAR1 antibody was preincubated with a blocking peptide at 20 μg/ml to show specificity (original magnification, ×40). (H) A higher magnification of infiltrated cells of the lamina propria (arrows and arrowheads) positively stained for PAR1 (original magnification, ×400).
Figure 3
Figure 3
Kinetic and dose-response curves of macroscopic-damage score (A and B) and myeloperoxidase (MPO) activity (E and F) induced by the intracolonic administration of the PAR1-activating peptide TFLLR-NH2, the control peptide RLLFT-NH2, or their vehicle, in C57BL/6 mice. (C and D) Representative H&E-stained histological sections of colons from WT mice that have received an intracolonic administration of TFLLR-NH2 (C) or RLLFT-NH2 (D). Values are mean ± SEM; n = 8 per group. *Significantly different from RLLFT-NH2–treated group, P < 0.05. Dose-response and histological sections were performed at the 24-hour time point after the intracolonic administration of RLLFT-NH2 or TFLLR-NH2. Scale bar: 15 μm (applies to C and D). In C, arrowheads show mucosal erosion, and arrows show submucosal edema.
Figure 4
Figure 4
Macroscopic-damage score (A) and MPO activity (B) induced by the intracolonic administration of the PAR1-activating peptide TFLLR-NH2 (200 μg/mouse) in PAR1-deficient mice (PAR1–/–) and their WT littermates (PAR1+/+), compared with naive mice (time 0). Values are mean ± SEM; n = 8 per group. *Significantly different from naive mice (time 0) of the corresponding genotype, P < 0.05.
Figure 5
Figure 5
Effects of vehicle or MLCK inhibitor (ML-7) pretreatment on changes in permeability (passage of EDTA radiolabeled with Chromium-51 [CrEDTA; Amersham Biosciences] from the intestinal lumen to the blood) (A), macroscopic-damage score (B), and MPO activity (C) in mice that have received intracolonically the PAR1-activating peptide TFLLR-NH2 or saline. (DF) Macroscopic-damage score (D), MPO activity (E), and wall thickness (F) in the colon of WT (C57BL/6), SCID, or RAG–/– mice. Values are mean ± SEM; n = 8 per group. *Significantly different from vehicle-treated mice for AC, and from mice treated with control peptide (RLLFT-NH2) for DF, P < 0.05. +Significantly different from saline-treated mice, P < 0.01. TF, TFLLR-NH2; RL, RLLFT-NH2.
Figure 6
Figure 6
Effects of intracolonic (i.c.) administration of PAR1-activating peptide TFLLR-NH2, control peptide RLLFT-NH2, or their vehicle (saline) on weight (A), macroscopic-damage score (B), and MPO activity (C), in C57BL/6 mice that have received an intracolonic administration of TNBS (1 mg/mouse in 40% ethanol). Values are mean ± SEM; n = 10 per group. *Significantly different from RLLFT-NH2–treated group.
Figure 7
Figure 7
Effect of systemic (Syst.) treatment with a PAR1 antagonist on survival rate (A), MPO activity (B and F), body weight (C and G), macroscopic- and microscopic-damage score (D, E, and H), and disease activity (I) in BALB/c mice, 7 days after the induction of colitis by intracolonic administration of TNBS at the dose of 2 mg per mouse in 50% ethanol (A and B) or at the dose of 1 mg/kg in 50% ethanol (CF), or 8 days after the induction of DSS colitis (GI). Values are mean ± SEM; n = 12 per group. *Significantly different from naive group; **significantly different from vehicle-treated group.
Figure 8
Figure 8
TNF-α (A and D), IFN-γ (B and D), and IL-12 (D) protein expression, and IFN-γ, TNF-α, IL-2, COX-1, COX-2, constitutive NO synthase (cNOS), iNOS, and β-actin mRNA levels (C), in the colon of BALB/c naive mice, TNBS- and PAR1 antagonist–treated mice, or TNBS- and vehicle-treated mice (AC), or in the colon of BALB/c naive mice, mice treated with DSS plus vehicle, or mice treated with DSS plus PAR1 antagonist (D). For A, B, and D, protein content of the mouse colon was determined by ELISA, and values are mean ± SEM; n = 12 per group. *Significantly different from naive group; **significantly different from vehicle-treated group. For C, RT-PCR mRNA amplification was representative of 12 mice per group for each mediator.
Figure 9
Figure 9
In vitro release of TNF-α (A) and IFN-γ (B and C) by lamina propria monocytic cells that were left unstimulated (Alone) or stimulated with CD3 and CD28 alone, CD3 and CD28 plus PAR1-activating peptide (PAR1-AP), or PAR1-activating peptide alone. Cells were isolated from naive (control) mice (AC) or were isolated 7 days after intracolonic administration of TNBS from mice that had been treated with the PAR1 antagonist (A and B) or with vehicle (AC). Values are mean ± SEM; n = 12 per group. *Significantly different from control group in A and B, and significantly different from medium alone in C; **significantly different from vehicle-treated group in A and B, and from naive group in C; ψsignificantly different from medium alone of cells from TNBS-treated mice.
Figure 10
Figure 10
Representative H&E-stained histological sections from WT (A and C) or PAR1-deficient (B and D) mice, in normal condition (no treatment) (A and B) or 7 days after the intracolonic administration of TNBS (1 mg/kg in 40% ethanol) (C and D). Scale bars: 20 μm.
Figure 11
Figure 11
Effect of intracolonic TNBS administration (AD) or DSS treatment (E and F) on survival rate (A), weight (B), macroscopic-damage score (C and E), and MPO activity (D and F) in PAR1-deficient mice (PAR1–/–) and WT littermates (PAR1+/+). Values are mean ± SEM; minimum of n = 10 per group. *Significantly different from PAR1–/– in B, and significantly different from WT in CF, P < 0.05.

Similar articles

Cited by

References

    1. Hollenberg MD, Compton SJ. International Union of Pharmacology. XXVIII. Proteinase-activated receptors. Pharmacol. Rev. 2002;54:203–217. - PubMed
    1. Macfarlane SR, Seatter MJ, Kanke T, Hunter GD, Plevin R. Proteinase-activated receptors. Pharmacol. Rev. 2001;53:245–282. - PubMed
    1. Hollenberg MD, Saifeddine M, Al-Ani B, Kawabata A. Proteinase-activated receptors: structural requirements for activity, receptor cross-reactivity, and receptor selectivity of receptor-activating peptides. Can. J. Physiol. Pharmacol. 1997;75:832–841. - PubMed
    1. Vergnolle N, Wallace JL, Bunnett NW, Hollenberg MD. Protease-activated receptors in inflammation, neuronal signaling and pain. Trends Pharmacol. Sci. 2001;22:146–152. - PubMed
    1. Lourbakos A, et al. Arginine-specific protease from Porphyromonas gingivalis activates protease-activated receptors on human oral epithelial cells and induces interleukin-6 secretion. Infect. Immun. 2001;69:5121–5130. - PMC - PubMed

Publication types

MeSH terms