Comparative Study
. 2004 Nov;114(10):1493-503.
doi: 10.1172/JCI19992.

Foxo1 mediates insulin action on apoC-III and triglyceride metabolism

Affiliations
Comparative Study

Foxo1 mediates insulin action on apoC-III and triglyceride metabolism

Jennifer Altomonte et al. J Clin Invest. 2004 Nov.

Abstract

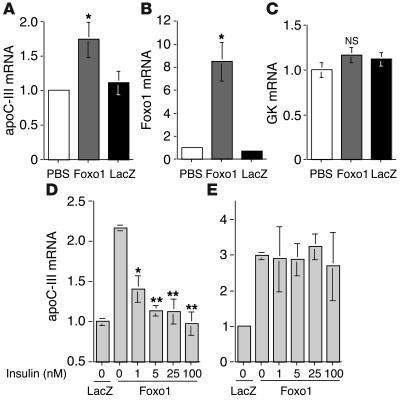
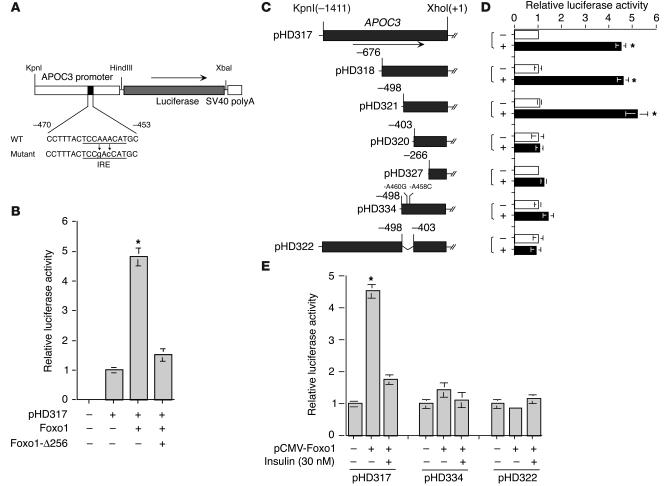
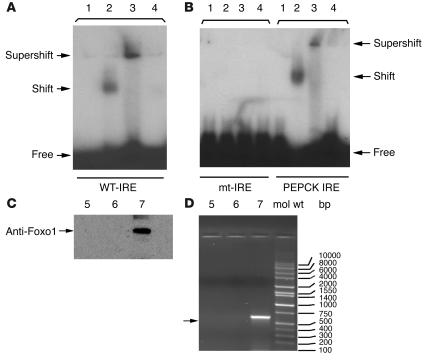
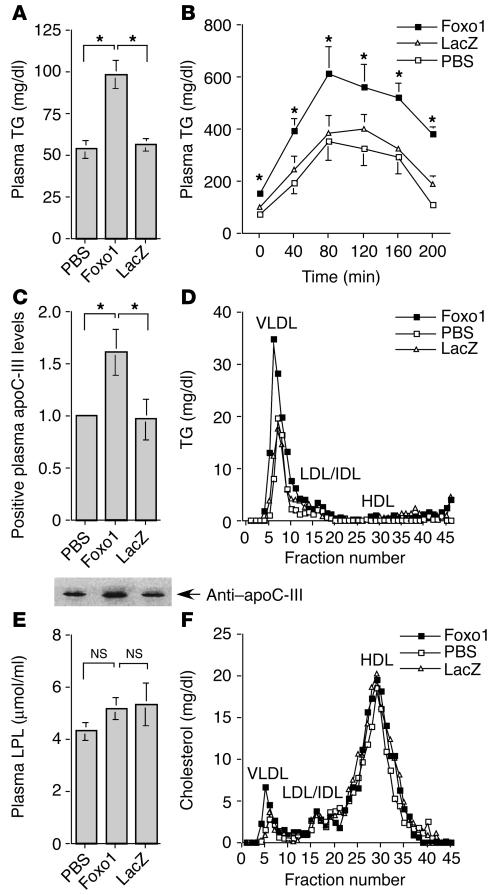
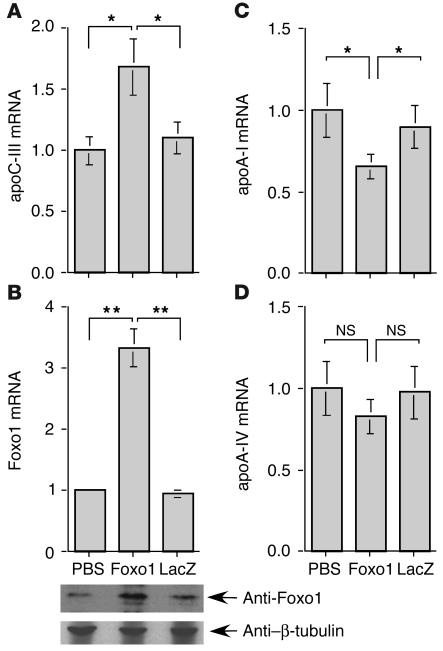
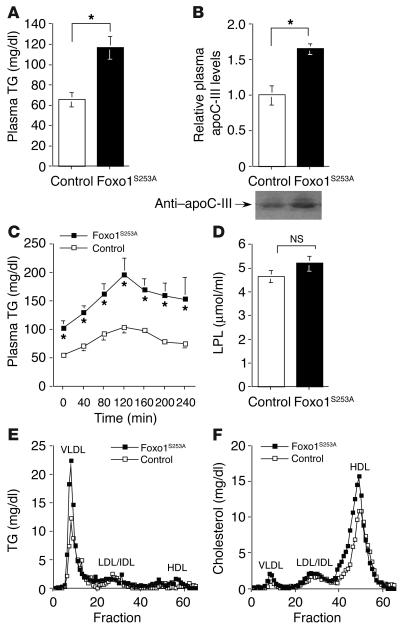
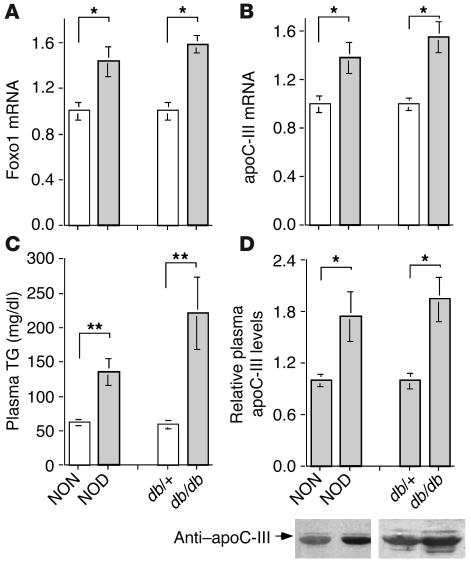
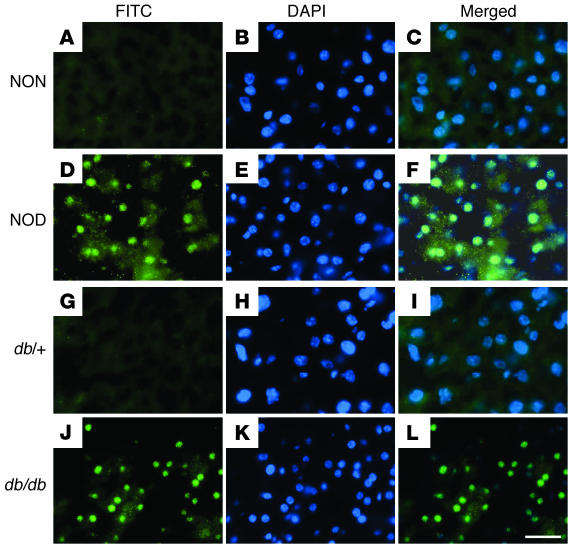
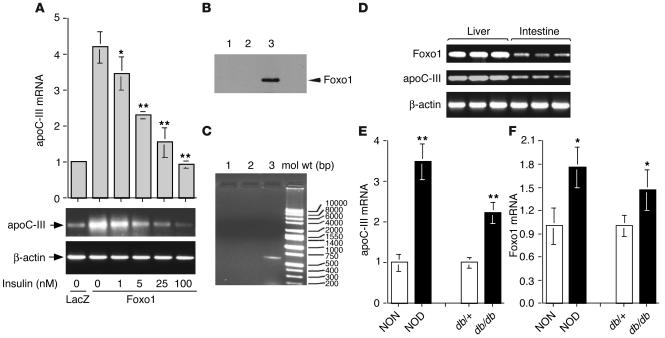
The apolipoprotein apoC-III plays an important role in plasma triglyceride metabolism. It is predominantly produced in liver, and its hepatic expression is inhibited by insulin. To elucidate the inhibitory mechanism of insulin in apoC-III expression, we delivered forkhead box O1 (Foxo1) cDNA to hepatocytes by adenovirus-mediated gene transfer. Foxo1 stimulated hepatic apoC-III expression and correlated with the ability of Foxo1 to bind to its consensus site in the apoC-III promoter. Deletion or mutation of the Foxo1 binding site abolished insulin response and Foxo1-mediated stimulation. Likewise, Foxo1 also mediated insulin action on intestinal apoC-III expression in enterocytes. Furthermore, elevated Foxo1 production in liver augmented hepatic apoC-III expression, resulting in increased plasma triglyceride levels and impaired fat tolerance in mice. Transgenic mice expressing a constitutively active Foxo1 allele exhibited hypertriglyceridemia. Moreover, we show that hepatic Foxo1 expression becomes deregulated as a result of insulin deficiency or insulin resistance, culminating in significantly elevated Foxo1 production, along with its skewed nuclear distribution, in livers of diabetic NOD or db/db mice. While loss of insulin response is associated with unrestrained apoC-III production and impaired triglyceride metabolism, these data suggest that Foxo1 provides a molecular link between insulin deficiency or resistance and aberrant apoC-III production in the pathogenesis of diabetic hypertriglyceridemia.


Figures

Figure 1
Figure 1
Effects of Foxo1 on hepatic apoC-III expression. Rat primary hepatocytes were transduced with Foxo1 or LacZ vector at an MOI of 50 PFU/cell or mock-transduced with PBS. After 24 hours of transduction, the intracellular levels of apoC-III (A), Foxo1 (B), and GK (C) mRNA were determined by real-time RT-PCR using β-actin mRNA as control. The effect of Foxo1 on hepatic apoC-III expression in response to insulin was assayed in HepG2 cells. Cells were transduced with Foxo1, Foxo1-ADA, or control LacZ vector (50 PFU/cell) in the absence or presence of insulin at different concentrations. Twenty-four hours after transduction, cells were collected for determination of the intracellular levels of apoC-III mRNA induced by Foxo1 (D) and Foxo1-ADA (E). *P < 0.05, **P < 0.005; significantly different from controls. NS, not significant by ANOVA. Data were from 3 independent experiments.
Figure 2
Figure 2
Effects of Foxo1 on the human APOC3 promoter activity. (A) The APOC-III promoter–directed luciferase reporter system. The wild-type and mutant IRE sequences are underlined. (B) Foxo1-mediated induction of the APOC3 promoter activity. HepG2 cells were transfected by pHD317 together with Foxo1 construct, or with both Foxo1 and Foxo1-Ø256 constructs. For each construct, 1 μg of DNA for each construct was used in transfection. For normalization of transfection efficiency, 1 μg pCMV5-LacZ DNA was included for normalization of transfection efficiency. (C) The APOC3 promoter variants in the luciferase reporter system. (D) Responses of APOC3 promoter variants to Foxo1 production. HepG2 cells were transfected with individual test plasmids in the absence (–) or presence (+) of pCMV5-Foxo1. The relative luciferase activity, after normalizing to β-gal activity, was compared between basal (–) and Foxo1-inducible (+) conditions. (E) Responses of wild-type and mutant APOC3 promoters to insulin. Test plasmids were transduced into HepG2 cells in the presence and absence of pCMV5-Foxo1 transfection in culture media, either supplemented with or without insulin (30 nM). The relative luciferase activity in transduced cells was determined using β-gal activity as control. *P < 0.001 vs. controls.
Figure 3
Figure 3
Molecular interaction between Foxo1 and the APOC3 promoter. Molecular association between Foxo1 and the APOC3 promoter was analyzed by EMSA and ChIP. Aliquots of Foxo1 protein from linked in vitro transcription-translation products (5 μg) were incubated with 2.5 μl of radioactively labeled DNA corresponding to –467/–440 nt in the human APOC3 promoter (WT-IRE) (A), a mutant APOC3 IRE (mt-IRE) containing 2 substitutions, of –A458C and –A460G, and a control PEPCK IRE DNA (B), followed by electrophoresis through 8% nondenaturing polyacrylamide gels for 30 minutes. Lane 1, DNA probe alone. Lane 2, DNA probe + Foxo1 protein lysates. Lane 3, DNA probe + Foxo1 protein lysates + anti-Foxo1 antibody (1 μg). Lane 4, DNA probe + Foxo1 protein lysates + nonlabeled competitor DNA at a molar concentration of 50-fold excess. Free, shifted, and supershifted DNA bands were visualized by autoradiography. For ChIP assay, HepG2 cells were transduced with Foxo1 vector at an MOI of 50 PFU/cell. Cells were harvested 24 hours later and subjected to ChIP using PBS as a negative control (lane 5), control IgG (lane 6), and anti-Foxo1 antibody (lane 7). The coimmunoprecipitated chromatin DNA was analyzed by immunoblot (C) using anti-Foxo1 antibody and PCR (D) using the primers that correspond to –655/–20 nt of the APOC3 promoter.
Figure 4
Figure 4
Effect of Foxo1 on hepatic apoC-III and plasma TG metabolism in vivo. CD-1 mice (12 weeks old) were stratified by body weight to ensure a similar mean body weight per group (31 ± 1.4 g, n = 6). The groups were Foxo1 vector–treated, LacZ vector–treated, or mock-treated. (A) Fasting plasma TG levels. Fasting plasma TG levels were determined on day 3 of hepatic Foxo1 production following an overnight fast. (B) Fat tolerance test. Plasma TG profiles in response to an oral bolus of olive oil were determined on day 4 after vector administration. (C) Plasma apoC-III levels. Mice were sacrificed after 1 week of hepatic Foxo1 production. Blood samples were collected for determination of the relative plasma apoC-III levels using a semi-quantitative immunoblot assay. A typical immunoblot is shown at the bottom of the panel. (D) TG levels in VLDL, LDL/IDL, and HDL fractions. Plasma (400 μl) pooled from individual mice at day 7 after vector administration was subjected to gel filtration column chromatography. Fifty fractions (200 μl per fraction) were eluted for determination of TG and cholesterol levels. (E) Plasma LPL activity. Post-heparin sera were obtained from individual mice on day 5 after vector administration and used for the determination of plasma LPL activity. (F) Cholesterol levels in VLDL, LDL/IDL, and HDL fractions, as described in D. *P < 0.05 by ANOVA.
Figure 5
Figure 5
Hepatic mRNA abundance in Foxo1 vector–treated mice. Total hepatic RNA was prepared for the determination of hepatic mRNA levels of apoC-III (A), Foxo1 (B), apoA-1 (C), and apoA-IV (D) using real-time RT-PCR. Hepatic protein extracts were prepared for immunoblot analysis of Foxo1 protein levels in Foxo1 vector– vs. control vector–treated mice using β-tubulin as control, as shown at the bottom of B. Values shown in the y axes are normalized to mock-treated controls. *P < 0.05 by ANOVA; **P < 0.001 by ANOVA.
Figure 6
Figure 6
Plasma TG metabolism in Foxo1 transgenic mice (4 months old). Foxo1S253A transgenic mice (n = 8) and control littermates (n = 8) were studied for fasting plasma TG levels (A), plasma apoC-III levels (B), plasma TG profiles in response to fat tolerance test (C), and plasma LPL activity (D). Sera (500 μl) pooled from individual mice were fractionated by fast-performance liquid chromatography through 2 consecutive Tricorn High-Performance Superose S-6 10/300GL Columns and 70 fractions (400 μl per fraction) were collected and assayed for TG (E) and cholesterol levels (F). *P < 0.01 by ANOVA.
Figure 7
Figure 7
Foxo1 and apoC-III expression in livers of NOD and db/db mice. Diabetic NOD (18-week-old) and db/db (6-month-old) mice, together with their respective NON and db/+ controls, were killed. Foxo1 (A) and apoC-III (B) mRNA in liver were determined by real-time RT-PCR using β-actin mRNA as control. The relative levels of plasma TG (C) and apoC-III (D) were determined in diabetic and control mice. Data in A, B, and D are plotted as relative values after normalization to controls. *P < 0.05 by ANOVA (n = 6); **P < 0.001 by ANOVA.
Figure 8
Figure 8
Immunohistochemistry. Liver tissues of diabetic NOD, db/db, and control mice were used for immunofluorescent labeling with rabbit anti-Foxo1 antibody (1:400 dilution). Foxo1 was immunostained green using donkey anti-rabbit IgG conjugated with FITC (1:200 dilution) (A, D, G, and J). Nuclei of hepatocytes were stained blue with DAPI (B, E, H, and K). Merged images are shown in C, F, I, and L. Scale bar: 200 μm.
Figure 9
Figure 9
Effects of Foxo1 on intestinal apoC-III expression. (A) Foxo1-dependent regulation of apoC-III expression in Caco-2 cells. Cells were transduced with Foxo1 vector (MOI, 500 PFU/cell) in the absence and presence of insulin at indicated concentrations. After 24 hours, cells were harvested for the determination of endogenous apoC-III mRNA expression by real- time RT-PCR. The products of real-time RT-PCR were analyzed on 0.7% agarose gels and visualized under UV lights after ethidium bromide staining (below A). (B) Immunoblot. Foxo1 vector–transduced Caco-2 cells were subjected to ChIP analysis using anti-Foxo1 antibody, control sheep IgG, or PBS. Immunoprecipitates were studied by immunoblot analysis. (C) PCR analysis of coimmunoprecipitated DNA by ChIP. (D) Foxo1 and apoC-III expression in liver versus intestine. RNA (1 μg) isolated from liver or intestine of lean C57BL/6J mice (n = 3) was analyzed by RT-PCR for Foxo1, apoC-III, and β-actin mRNA abundance. RT-PCR products were resolved on a 0.7% agarose gel and visualized under UV -light after staining with ethidium bromide. (E) Intestinal apoC-III mRNA levels. (F) Intestinal Foxo1 mRNA levels. The relative levels of apoC-III and Foxo1 mRNA in intestine of diabetic NOD and db/db versus nondiabetic control mice were determined by real-time RT-PCR using β-actin mRNA as control. *P < 0.05 and **P < 0.001 vs. controls.

References

    1. Wang C, McConathy WJ, Kloer HJ, Alaupovic P. Modulation of lipoprotein lipase activity by apolipoproteins: effect of apolipoprotein C-III. J. Clin. Invest. 1985;75:384–390. - PMC - PubMed
    1. McConathy WJ, Gesquiere JC, Bass H, Tartar A, Fruchart JC. Inhibition of lipoprotein lipase activity by synthetic peptides of apolipoprotein C-III. J. Lipid Res. 1992;33:995–1003. - PubMed
    1. Kinnunen PKJ, Ehnholm C. Effect of serum and C apolipoproteins from very low density lipoproteins on human post-heparin plasma hepatic lipase. FEBS Lett. 1976;65:354–357. - PubMed
    1. Wuarfordt SH, Michalopoulos G, Schirmer B. The effect of human C apolipoproteins on the in vitro hepatic metabolism of triglyceride emulsions in the rat. J. Biol. Chem. 1982;257:14642–14647. - PubMed
    1. Windler E, Havel RJ. Inhibitory effect of C apolipoprotein from rats and humans on the uptake of triglyceride-rich lipoproteins and their remnants by the perfused rat liver. J. Lipid Res. 1985;26:556–565. - PubMed

Publication types

MeSH terms