

Quantitative visualization of ictal subdural EEG changes in children with neocortical focal seizures
- PMID: 15546780
- PMCID: PMC1360693
- DOI: 10.1016/j.clinph.2004.06.020
Quantitative visualization of ictal subdural EEG changes in children with neocortical focal seizures
Abstract
Objective: To quantify the ictal subdural electroencephalogram (EEG) changes using spectral analysis, and to delineate the quantitatively defined ictal onset zones on high-resolution 3D MR images in children with intractable neocortical epilepsy.
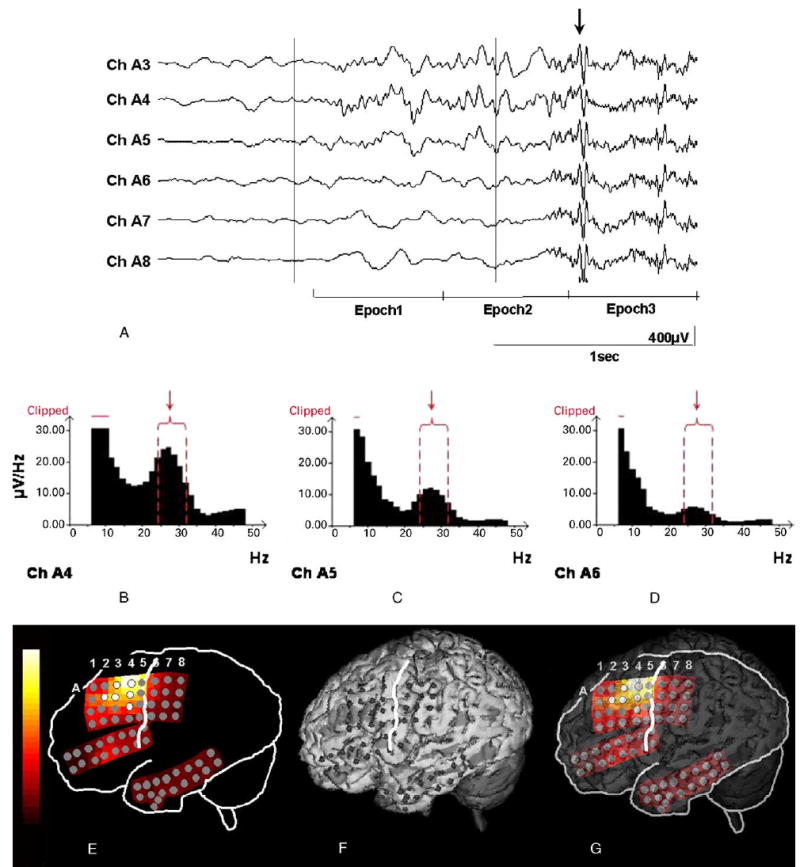
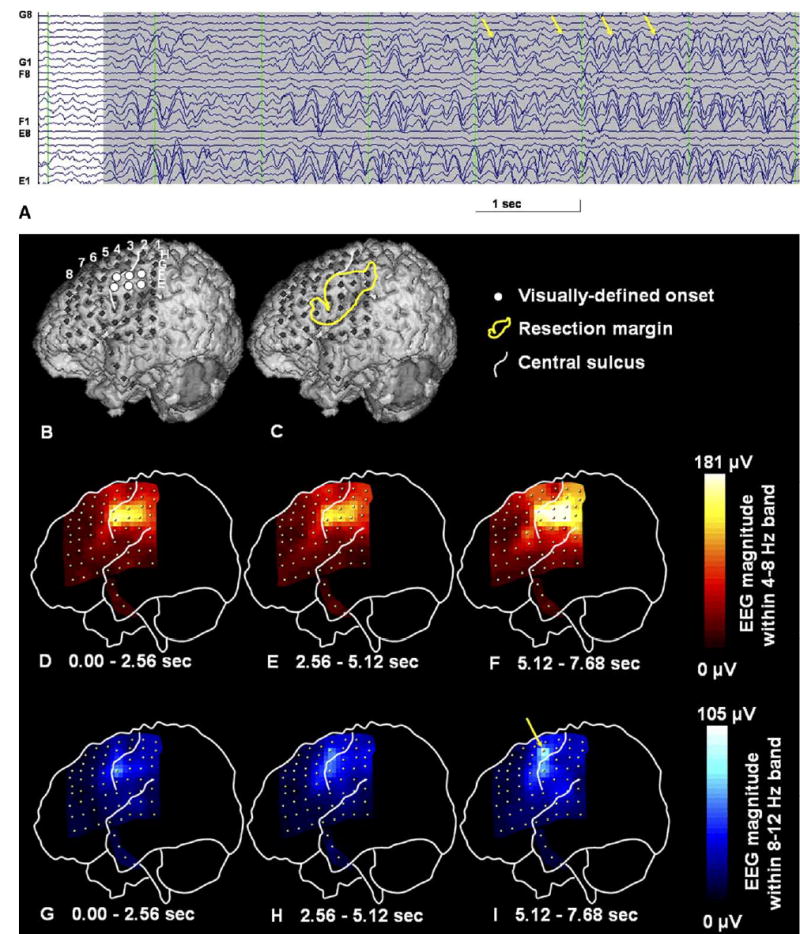
Methods: Fourteen children with intractable neocortical epilepsy (age: 1-16 years) who had subsequent resective surgery were retrospectively studied. The subjects underwent a high-resolution MRI and prolonged subdural EEG recording. Spectral analysis was applied to 3 habitual focal seizures. After fast Fourier transformation of the EEG epoch at ictal onset, an amplitude spectral curve (square root of the power spectral curve) was created for each electrode. The EEG magnitude of ictal rhythmic discharges was defined as the area under the amplitude spectral curve within a preset frequency band including the ictal discharge frequency, and calculated for each electrode. The topography mapping of ictal EEG magnitude was subsequently displayed on a surface-rendered MRI. Finally, receiver operating characteristic (ROC) analysis was performed to evaluate the consistency between quantitatively and visually defined ictal onset zones.
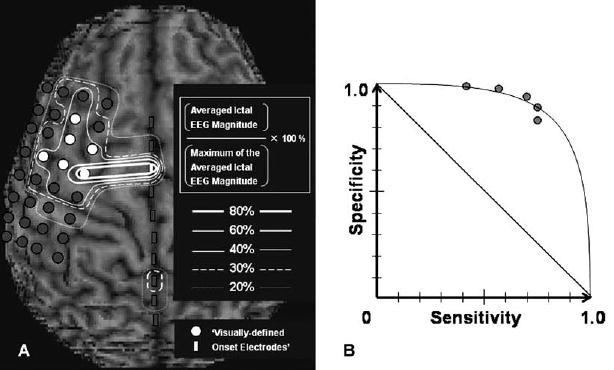
Results: The electrode showing the maximum of the averaged ictal EEG magnitude was part of the visually defined ictal onset zone in all cases. ROC analyses demonstrated that electrodes showing >30% of the maximum of the averaged ictal EEG magnitude had a specificity of 0.90 and a sensitivity of 0.74 for the concordance with visually defined ictal onset zones.
Significance: Quantitative ictal subdural EEG analysis using spectral analysis may supplement conventional visual inspection in children with neocortical epilepsy by providing an objective definition of the onset zone and its simple visualization on the patient's MRI.
Figures
References
-
- Adeli H, Zhou Z, Dadmehr N. Analysis of EEG records in an epileptic patient using wavelet transform. J Neurosci Methods. 2003;123:69–87. - PubMed
-
- Akin M. Comparison of wavelet transform and FFT methods in the analysis of EEG signals. J Med Syst. 2002;26:241–7. - PubMed
-
- Alarcon G, Binnie CD, Elwes RD, Polkey CE. Power spectrum and intracranial EEG patterns at seizure onset in partial epilepsy. Electroencephalogr Clin Neurophysiol. 1995;94:326–37. - PubMed
-
- Blanke O, Lantz G, Seeck M, Spinelli L, Grave de Peralta R, Thut G, Landis T, Michel CM. Temporal and spatial determination of EEG-seizure onset in the frequency domain. Clin Neurophysiol. 2000;111:763–72. - PubMed
-
- Chen LS, Otsubo H, Ochi A, Lai WW, Sutoyo D, Snead OC., 3rd Continuous potential display of ictal electrocorticography. J Clin Neurophysiol. 2002;19:192–203. - PubMed
Publication types
MeSH terms
Grants and funding
LinkOut - more resources
Full Text Sources
