. 2004 Nov 30;101(48):16774-9.
doi: 10.1073/pnas.0405368101. Epub 2004 Nov 16.

On the mechanism and biology of cytochrome oxidase inhibition by nitric oxide

Affiliations

On the mechanism and biology of cytochrome oxidase inhibition by nitric oxide

Fernando Antunes et al. Proc Natl Acad Sci U S A. .

Abstract

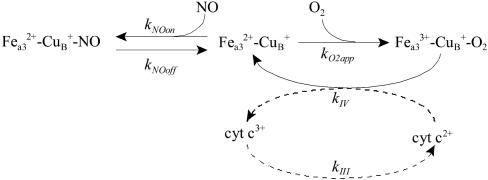
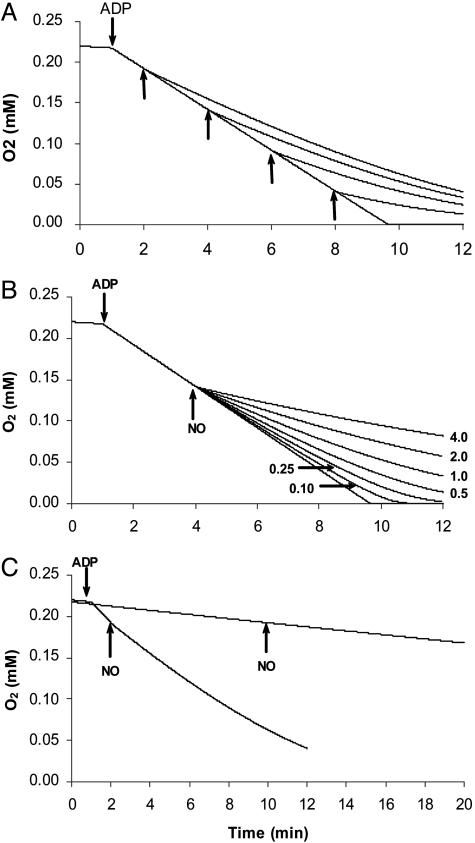
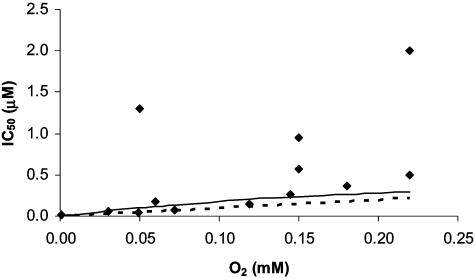
The detailed molecular mechanism for the reversible inhibition of mitochondrial respiration by NO has puzzled investigators: The rate constants for the binding of NO and O2 to the reduced binuclear center CuB/a3 of cytochrome oxidase (COX) are similar, and NO is able to dissociate slowly from this center whereas O2 is kinetically trapped, which altogether seems to favor the complex of COX with O2 over the complex of COX with NO. Paradoxically, the inhibition of COX by NO is observed at high ratios of O2 to NO (in the 40-500 range) and is very fast (seconds or faster). In this work, we used simple mathematical models to investigate this paradox and other important biological questions concerning the inhibition of COX by NO. The results showed that all known features of the inhibition of COX by NO can be accounted for by a direct competition between NO and O2 for the reduced binuclear center CuB/a3 of COX. Besides conciliating apparently contradictory data, this work provided an explanation for the so-called excess capacity of COX by showing that the COX activity found in tissues actually is optimized to avoid an excessive inhibition of mitochondrial respiration by NO, allowing a moderate, but not excessive, overlap between the roles of NO in COX inhibition and in cellular signaling. In pathological situations such as COX-deficiency diseases and chronic inflammation, an excessive inhibition of the mitochondrial respiration is predicted.


Figures

Scheme 1.
Scheme 1.
Models describe the inhibition of the respiratory chain by NO in competition with O2. Shown are a minimal model (continuous-line-depicted reactions, model 1) and an extended model (continuous- and dashed-line-depicted reactions, model 2). kNOon and kO2app refer to rate constants describing the combination of NO and O2 with the reduced cytochrome a3–CuB site (Fea32+–CuB+) of COX, respectively. kNOoff refers to the release of NO from the reduced cytochrome a3–CuB site. kIV, first-order rate constant in model 1 and second-order rate constant in model 2, refers to the reduction of the cyt a3–CuB site entailing the arrival to COX of electrons from the other mitochondrial complexes, via cytochrome c (cyt c). kIII, a first-order rate constant, refers to the reduction of cytochrome c in complex III. Fea33+–CuB+–O2 species aggregates the intermediate forms appearing in the COX catalytic cycle. Mass action kinetics were assumed, and simulations were carried out with gepasi (45) and plas (46).
Fig. 1.
Fig. 1.
Simulation of typical experiments with isolated mitochondria on the inhibition of respiration by NO. (A) NO was added at 1 μM as indicated by the arrows. (B) NO was added at 4.0, 2.0, 1.0, 0.5, 0.25, or 0.10 μM at 4 min, when O2 concentration was 142 μM. (C) NO at 1 μM was added to respiration with high turnover (state 3-like) and with low turnover (state 4-like). Model 1 was used with the following parameters: COX initial concentration was 0.014 μM (at time 0 it was assumed that all COX was in the form Fea32+–CuB+), which is equivalent to 0.1 mg of mitochondrial protein per ml; O2 initial concentration was 220 μM; kNOon = 4 × 10⁷ M–1·s–1; kNOoff = 0.13 s–1; kO2app = 1.4 × 10⁸ M–1·s–1; kIV = 3 s–1 (to simulate state 4 respiration); and kIV = 30 s–1 (to simulate state 3 respiration). Transition between state 4 and state 3 is indicated by the addition of ADP.
Fig. 2.
Fig. 2.
Experimental (♦) and simulated (lines) IC50 values for the inhibition of mitochondrial respiration by NO. IC50 values obtained with model 1 (continuous line) were calculated by using Eq. 4 with kNOon = 4 × 10⁷ M–1·s–1, kNOoff = 0.02 s–1, and kIV = 30 s–1.IC50 values obtained with model 2 (dashed line) were calculated from simulations in which O2 concentration was held constant and NO concentration was varied as a parameter; parameters used were as follows: kNOon = 4 × 10⁷ M–1·s–1, kNOoff = 0.01 s–1, kIV = 1.5 × 10⁶ M–1·s–1, kIII = 23.3 s–1, [cyt c]tot = 200 μM, and [COX]tot = 140 μM. kNOoff in model 2 was half of that in model 1. In both models, the functional dependency of kO2app on the concentration of O2 (see Supporting Text) was explicitly considered. Experimental data were taken from refs. , , , , , , and .
Fig. 3.
Fig. 3.
Simulation of the inhibition of state 3 and state 4 mitochondrial respiration by NO in a typical experiment, in vitro (A) ([O2] = 150 μM) and in vivo under normoxia (B) ([O2] = 30 μM) or hypoxia (C) ([O2] = 5 μM) conditions. Model 2 was used with the following parameters: kNOon = 4 × 10⁷ M–1·s–1, kNOoff = 0.01 s–1, kO2app = 1.4 × 10⁸ M–1·s–1, kIV = 1.5 × 10⁶ M–1·s–1, [cyt c]tot = 200 μM, and [COX]tot = 140 μM. Low COX activity in A was simulated by setting [COX]tot at 46.7 μM. State 3 was simulated by setting kIII at 23.3 s–1. State 4 was simulated by setting kIII at 7.77 s–1 (A, to simulate experiment in ref. 19) or 2.33 s–1 (B and C). Notice the difference in the x scales. Arrows indicate range for NO concentration.
Fig. 4.
Fig. 4.
Relationship between activity of COX and NO inhibition of mitochondrial respiration in state 3 in vivo. Model 2 was used with the following parameters: [O2] = 30 μM; [NO] = 0.03 μM, where indicated; kIII = 23.3 s–1; [COX]tot was changed as indicated; and kIV was changed to keep [COX]tot× kIV constant. Other parameters were as in Fig. 3.

References

    1. Brown, G. C. & Cooper, C. E. (1994) FEBS Lett. 356, 295–298. - PubMed
    1. Cleeter, M. J. W., Cooper, J. M., Darley-Usmar, V. M., Moncada, S. & Schapira, A. H. V. (1994) FEBS Lett. 345, 50–54. - PubMed
    1. Poderoso, J. J., Carreras, M. C., Lisdero, C., Riobo, N., Schopfer, F. & Boveris, A. (1996) Arch. Biochem. Biophys. 328, 85–92. - PubMed
    1. Boveris, A., Costa, L. E., Poderoso, J. J., Carreras, M. C. & Cadenas, E. (2000) Ann. N.Y. Acad. Sci. 899, 121–135. - PubMed
    1. Moncada, S. & Erusalimsky, J. D. (2002) Nat. Rev. Mol. Cell Biol. 3, 214–220. - PubMed

Publication types

MeSH terms

LinkOut - more resources