. 2004 Dec;10(12):1867-87.
doi: 10.1261/rna.7140504.

Crystal structure of a group I intron splicing intermediate

Affiliations

Crystal structure of a group I intron splicing intermediate

Peter L Adams et al. RNA. 2004 Dec.

Abstract

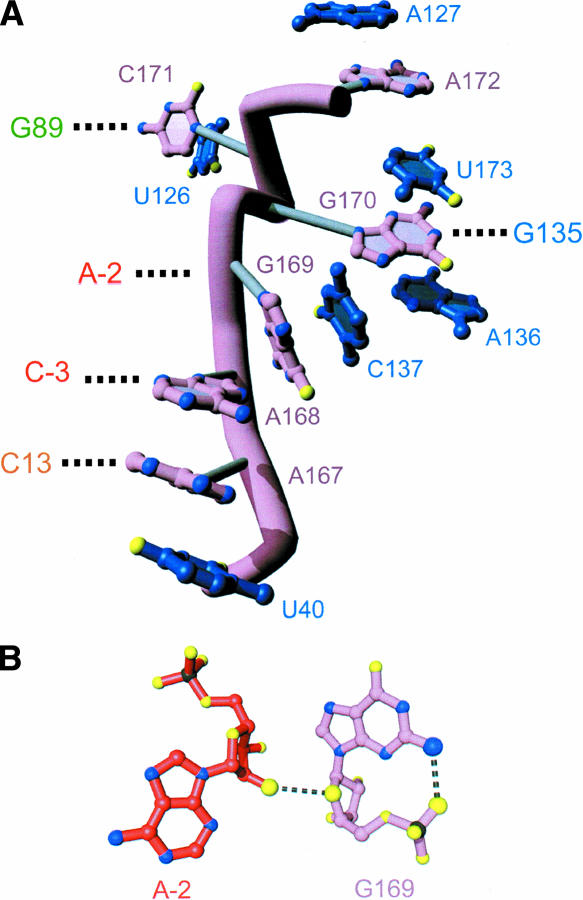
A recently reported crystal structure of an intact bacterial group I self-splicing intron in complex with both its exons provided the first molecular view into the mechanism of RNA splicing. This intron structure, which was trapped in the state prior to the exon ligation reaction, also reveals the architecture of a complex RNA fold. The majority of the intron is contained within three internally stacked, but sequence discontinuous, helical domains. Here the tertiary hydrogen bonding and stacking interactions between the domains, and the single-stranded joiner segments that bridge between them, are fully described. Features of the structure include: (1) A pseudoknot belt that circumscribes the molecule at its longitudinal midpoint; (2) two tetraloop-tetraloop receptor motifs at the peripheral edges of the structure; (3) an extensive minor groove triplex between the paired and joiner segments, P6-J6/6a and P3-J3/4, which provides the major interaction interface between the intron's two primary domains (P4-P6 and P3-P9.0); (4) a six-nucleotide J8/7 single stranded element that adopts a mu-shaped structure and twists through the active site, making critical contacts to all three helical domains; and (5) an extensive base stacking architecture that realizes 90% of all possible stacking interactions. The intron structure was validated by hydroxyl radical footprinting, where strong correlation was observed between experimental and predicted solvent accessibility. Models of the pre-first and pre-second steps of intron splicing are proposed with full-sized tRNA exons. They suggest that the tRNA undergoes substantial angular motion relative to the intron between the two steps of splicing.


Figures

FIGURE 1.
FIGURE 1.
(A) Secondary structures for the wild type (left) and pre-2S crystallized (right) forms of the Azoarcus Ile-tRNA intron. Residues in the wild type sequence that were deleted within the pre-2S complex are shown in red. Residues mutated from wild type are shown in green. Note that there is a shift in the P10 base-pairing register between the wild type and crystallized complex. The four sites of 2′-deoxyribose substitution in the complex are underlined in blue (right). Exon residues that base pair to form the tRNA anticodon helix during the second step of splicing are indicated in black rectangles. The anticodon helix has been eliminated in the crystallized pre-2S complex. Nucleotide insertions within P6a and L6a are indicated with arrowheads (left) and brackets (right). The scissile phosphate is shown as a black circle. (B) Reactivity of the pre-2S complex containing ribose or 2′-deoxy at the ligation junction. The length of incubation time for each reaction is indicated, as well as the presence (+) or absence (−) of various components in the complex. In this experiment the 3′-exon oligonucleotide CIRC (d or r) oligonucleotide is 5′-end labeled. Reaction with the 5′-exon oligonucleotide (CAT or CAU) transfers the last six nucleotides onto the 5′-exon, which reduces the length of CIRC from 22 to 16 nucleotides. In all cases involving rCIRC the reaction proceeds to an equilibrium between the forward and the reverse ligation reactions with an endpoint of ~40% ligated (Mei and Herschlag 1996).
FIGURE 2.
FIGURE 2.
Overall secondary and tertiary structure of the Azoarcus Ile-tRNA intron pre-2S complex. (A) Secondary structure. The intron sequences, exon sequences, and structural elements (P and J elements) are depicted in the colors used for most of the subsequent figures. The secondary structure scheme follows that observed within the structure and differs slightly from that previously proposed for the intron, primarily in the P9.0 region (Reinhold-Hurek and Shub 1992; Tanner and Cech 1996). The ligation reaction catalyzed by this complex is shown by black arrows. The RNA transcript (UP62) comprising the majority of the intron is shown with capital letters, while residues derived from the two chimeric oligonucleotides dCIRC (intron/3′-exon segment) and CAT (5′-exon segment) are shown in lower case letters. The break between dCIRC and UP62 is indicated with a jagged line. The locations of the last three J8/7 residues are indicated as three labeled boxes positioned adjacent to the residues with which each nucleotide interacts. Intron numbering follows the canonical nomenclature established for group I introns, wherein the αG added in the first step of splicing is numbered 1 (Burke et al. 1987). This numbering differs by +1 from some reports on this intron (Reinhold-Hurek and Shub 1992; Tanner and Cech 1996; Rangan et al. 2003). (B) Tertiary structure in stereo representation. The backbone is depicted with a ribbon and individual bases depicted as cylinders. The color of the ribbon follows that shown in part A. This and many of the subsequent structure figures were prepared using RIBBONS (Carson 1991) and rendered using PovRay.
FIGURE 3.
FIGURE 3.
Temperature (B) factors superimposed on a ribbon of the pre-2S tertiary structure. B factors between 0–50 Å2 are shown in blue, values between 50–100 Å2 in green, and values between 100–150 Å2 in red. The region of greatest disorder within the structure is the P6a helix and the U1A protein bound at its end. The lowest B factors are found within the intron active site.
FIGURE 4.
FIGURE 4.
Schematic tertiary structural view of the intron using the symbolism described in Leontis and Westhof (2001). The symbol key is included at the bottom of the figure. Individual nucleotide numbers, helical elements, and joiner regions are indicated. The 5′ and 3′ exons are indicated within shaded red rectangles. Nucleotides within the UP62 transcript are in capital letters, while those in the two oligonucletides are depicted in lowercase letters.
FIGURE 5.
FIGURE 5.
Two tetraloop-tetraloop receptor (TL/TLR) interactions on opposite ends of the Azoarcus intron. (A) Depiction of the pre-2S complex with emphasis on the two TL/TLR interactions. The L2 (orange) interaction with J8/8a (blue) and the L9 (purple) interaction with J5/5a (green) are both highlighted. The rest of the intron and the U1A protein are in gray. The 5′ and 3′ exons are in red. (B) Superposition of the backbone trace of the Tetrahymena L5b-J6a/6b TL/TLR motif (dark blue) with the two examples found in the Azoarcus intron. The L2-J8/8a interaction is shown in light blue, while the L9-J5/5a interaction is in red. (C) Electron density for the L9-J5/5a TL/TLR showing that the RNA is well ordered despite the nick in the L9 tetraloop. The experimental electron density contoured at 2′ is shown as a blue web. Note the break in electron density between residues A190 and A191, which marks the covalent break in the RNA.
FIGURE 6.
FIGURE 6.
The pseudoknot belt that reaches around the circumference of the pre-2S complex at the intron’s midpoint. Residues A34-A59 are shown as an orange ribbon with orange cylinders for the bases. The U1A protein and the rest of the intron are shown in gray with gray cylinders for the bases. The 5′ and 3′ exons are shown in red. (A) Front view. (B) Top view (in stereo representation) looking down the P1-P10 helical axis (upper left).
FIGURE 7.
FIGURE 7.
Tertiary interactions with the P4-P6 helical domain. The P4-P6 helix is shown as a green ribbon. The rest of the intron and both exons are in a thin light gray ribbon. All of the residues within the complex that make tertiary contact with the domain are shown as bases with a stick connection to the backbone trace. The identity of each of these is labeled. The color scheme follows that established in Figure 2A. Alternative colors are used in the joiner regions to emphasize the large number of structural elements that are organized around the P4-P6 helix. (A) Side view. (B) Top view. The tertiary contacts made with the P4-P6 minor groove are located outside the green helical ribbon, while the major groove contacts made by J6/7 and J8/7 (Fig. 12) are positioned inside the cylinder created by the helical ribbon. A complete list of the tertiary interactions to the P4-P6 domain is compiled in Table 1.
FIGURE 8.
FIGURE 8.
Tertiary interactions to the P3-P9.0 helical domain (A) and P1-P10 domain (B). The figures are organized as in Figure 7 with the P3-P9.0 helix shown in blue ribbons (A) and the P1-P10 helix shown in orange and red ribbons (B). Each nucleotide that contacts the helix is shown in full. Lists of the tertiary interactions to the P3-P9.0 domain and P1-P10 domain are compiled in Tables 2 and 3, respectively.
FIGURE 9.
FIGURE 9.
Detailed structural depiction of the J2/3 joiner segment (blue) and its tertiary interactions (black dashed lines) with the P2 helix (orange). Tertiary interaction between the first three residues in J8/7 (pink) and the P2 and P1 helices are also shown. The 5′-exon is in red. Functional groups involved in tertiary hydrogen bonds are shown as enlarged spheres.
FIGURE 10.
FIGURE 10.
Detailed structural depiction of the J3/4 segment (orange) and its tertiary hydrogen bonding interactions (black dashed lines) with the P6 helix (green ribbon). Tertiary interactions between the J6/6a (red) and the P3 helix (blue ribbon) are also shown. Functional groups involved in tertiary hydrogen bonds are shown as enlarged spheres. Hydrogen bonds are made to the O2′ of a nucleotide depicted at the midpoint of the cylinder connecting the base to the helical ribbon. The transition of the P6 strand into the J6/7 element is labeled, as are other features of the structure. Functional groups in the J3/4 or J6/6a region involved in tertiary hydrogen bonds are shown as enlarged spheres. (A) Side view shown in stereo representation. (B) Top view looking down the continuous base stack created between the J3/4 and J6/6a segments.
FIGURE 11.
FIGURE 11.
Detailed structural depiction of the J6/7 segment (blue) and its tertiary hydrogen bonding interactions (red dashed lines) with the major groove of the P4 helix (green ribbon). Tertiary interactions with the last two nucleotides of the J8/7 region (pink) and the ΩG206 (purple) are also shown.
FIGURE 12.
FIGURE 12.
Schematic depiction of the J8/7 segment. (A) The μ shaped backbone of this single-stranded element is shown as a ribbon (pink). The six individual J8/7 bases are shown in pink with gray cylinders connecting them to the back bone. The bases of nucleotides that make stacking interactions with the J8/7 segment are shown in blue. Nucleotides that form tertiary hydrogen bonding interactions with J8/7 are not shown, but their approximate placement within the structure is indicated by a label. The color of this label follows the scheme established in Figure 1. (B) The G169 (pink) triple with A-2 (red). The intranucleotide and internucleotide hydrogen bonds are shown as black dashed cylinders to atoms depicted as enlarged spheres. Individual oxygen (yellow), nitrogen (blue), and phosphorous atoms are colored differently from the rest of the nucleotide.
FIGURE 13.
FIGURE 13.
Type I and type II A minor motifs throughout the Azoarcus group I intron. (Left) Examples of the type I (orange adenosine with green base pair) and type II (blue adenosine with green base pair). Hydrogen bonds shown as dashed black cylinders. (Right) Placement of the five type I (orange) and six type II (blue) A minor motifs within the overall structure. The entire intron and the U1A protein are shown as a gray ribbon. The 5′ and 3′ exons are shown as a red ribbon.
FIGURE 14.
FIGURE 14.
Schematic depiction of the base stacking within the Azoarcus pre-2S complex. Each nucleotide is depicted as a rectangle labeled with the nucleotide number and sequence. The relative placement of the rectangles denotes stacking interactions. Standard stacking interactions within a helix are shown as two parallel brown lines between each nucleotide. Cross-strand stacking contacts are shown as a thick blue line between the rectangles. Tertiary strand stacking contacts are shown as a thick red line between the rectangles. No effort is made in this figure to depict tertiary contacts (Fig. 4). Individual helices and joiner elements are labeled. The connectivity of the strands is shown with colored lines. The color scheme follows that established in Figure 1.
FIGURE 15.
FIGURE 15.
Cross strand purine stack in P4. (A) Cross strand stack in helix P4 between Azoarcus residues G56 and G89. Residue C171 (pink) and the catalytic metal ion (orange) coordinated to the C88 phosphate are also shown. (B) Equivalent region from the P4-P6 crystal structure showing the absence of the cross strand stack. The other elements are not present in P4-P6 domain structure, which may account for the different stacking interactions in this region.
FIGURE 16.
FIGURE 16.
Intermolecular crystal contacts. (A) View down one of the two two-fold symmetry axes in the crystal. The U1A proteins are shown in gray. Individual pre-2S complexes are shown as ribbons of various colors. The contacts between L8a and P9 and the top of P10 are labeled. The L5a-L5a contact is also labeled. (B) View down the other two-fold axis within the crystal. This rather intimate homodimer occurs between residues in P2 and P5a.
FIGURE 17.
FIGURE 17.
Superposition of the Azoarcus pre-2S and Tetrahymena P3-P9 apoenzyme structures. The alignment of the superposition is depicted within the P3 region, where pre-2S is shown in orange and the apoenzyme is shown in gray. The first six base pairs below the 5′ splice site from the pre-2S P1-P2 helical stack is shown as a transparent orange surface. The backbone of the J8/7 (pink) and P4 (green) strands of pre-2S are shown as cylinders. The equivalent strands from the P3-P9 structure are shown in gray. Note how the J8/7 segment overlaps extensively with the 5′ exon and how the P4 strand overlaps extensively with the IGS. This figure was prepared using PyMOL (DeLano 2002).
FIGURE 18.
FIGURE 18.
Hydroxyl radical mapping of the Azoarcus pre-2S complex. (A) Secondary structure map of hydroxyl radical protections. The color of the letters indicates residues whose C4′ proton is predicted to be protected (red) or solvent accessible (black) within the crystal structure using a 1.4 Å probe. Positions that were protected from hydroxyl radical reactivity in solution are enclosed in red boxes. Gray squares indicate positions that could not be quantitated due to degradation, band compression within the sequencing gel, or close proximity to the end of an RNA strand. (B) Front view of hydroxyl radical protections mapped onto the pre-2S crystal structure. The backbone color indicates areas of predicted protection (blue) and predicted solvent accessibility (red). Areas that could not be quantitated are colored gray. Blue spheres indicate C4′ atoms that were resistant to hydroxyl radicals in solution. The sphere size correlates with the degree of protection (small: 1.5–2.0, medium: 2.0–3.0, large: >3.0). (C) As in B, but rotated 90° about the P4-P6 axis so the clustering of protected residues along the interior of the pre-2S structure can be visualized.
FIGURE 19.
FIGURE 19.
(A) Secondary structures of four intermediates in the group I intron splicing reaction: pre-1S, post-1S, pre-2S, and post-2S. These are shown with all the nucleotides in the Ile-tRNA anticodon helix. (B) Model of the pre-1S complex including a P1a helix and a full tRNA. The assumptions used to create this model are described in the text. The color scheme follows that of Figure 1 with the 5′ and 3′ exons extended in red ribbon. (C) Model of the pre-2S complex including the full tRNA.

Similar articles

Cited by

References

    1. Adams, P.L., Stahley, M.R., Kosek, A.B., Wang, J., and Strobel, S.A. 2004. Crystal structure of a self-splicing group I intron with both exons. Nature 430: 45–50. - PubMed
    1. Bass, B.L. and Cech, T.R. 1984. Specific interaction between the self-splicing RNA of Tetrahymena and its guanosine substrate: Implications for biological catalysis by RNA. Nature 308: 820–826. - PubMed
    1. ———. 1986. Ribozyme inhibitors: Deoxyguanosine and dideoxyguanosine are competitive inhibitors of self-splicing of the Tetrahymena ribosomal ribonucleic acid precursor. Biochemistry 25: 4473–4477. - PubMed
    1. Basu, S., Rambo, R.P., Strauss-Soukup, J., Cate, J.H., Ferre-D Amare, A.R., Strobel, S.A., and Doudna, J.A. 1998. A specific monovalent metal ion integral to the A-A platform of the RNA tetraloop receptor. Nat. Struct. Biol. 5: 986–992. - PubMed
    1. Been, M.D. 1994. Cis- and trans-acting ribozymes from a human pathogen, hepatitis delta virus. Trends Biochem. Sci. 19: 251–256. - PubMed

Publication types