

Population structure and evolution of the Bacillus cereus group
- PMID: 15547268
- PMCID: PMC529064
- DOI: 10.1128/JB.186.23.7959-7970.2004
Population structure and evolution of the Bacillus cereus group
Abstract
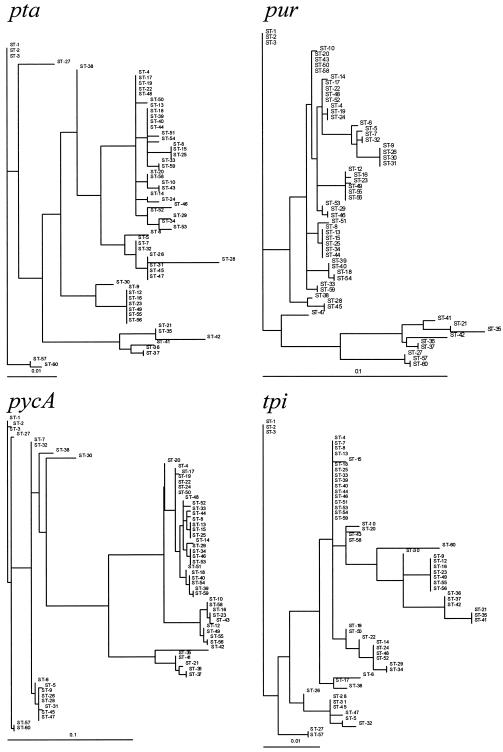
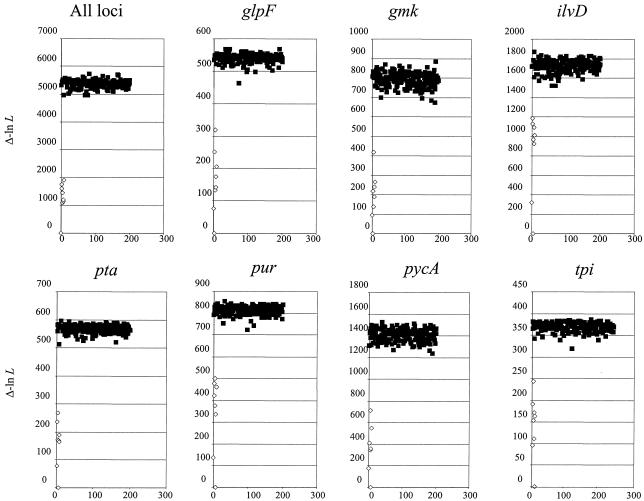
Representative strains of the Bacillus cereus group of bacteria, including Bacillus anthracis (11 isolates), B. cereus (38 isolates), Bacillus mycoides (1 isolate), Bacillus thuringiensis (53 isolates from 17 serovars), and Bacillus weihenstephanensis (2 isolates) were assigned to 59 sequence types (STs) derived from the nucleotide sequences of seven alleles, glpF, gmk, ilvD, pta, pur, pycA, and tpi. Comparisons of the maximum likelihood (ML) tree of the concatenated sequences with individual gene trees showed more congruence than expected by chance, indicating a generally clonal structure to the population. The STs followed two major lines of descent. Clade 1 comprised B. anthracis strains, numerous B. cereus strains, and rare B. thuringiensis strains, while clade 2 included the majority of the B. thuringiensis strains together with some B. cereus strains. Other species were allocated to a third, heterogeneous clade. The ML trees and split decomposition analysis were used to assign STs to eight lineages within clades 1 and 2. These lineages were defined by bootstrap analysis and by a preponderance of fixed differences over shared polymorphisms among the STs. Lineages were named with reference to existing designations: Anthracis, Cereus I, Cereus II, Cereus III, Kurstaki, Sotto, Thuringiensis, and Tolworthi. Strains from some B. thuringiensis serovars were wholly or largely assigned to a single ST, for example, serovar aizawai isolates were assigned to ST-15, serovar kenyae isolates were assigned to ST-13, and serovar tolworthi isolates were assigned to ST-23, while other serovars, such as serovar canadensis, were genetically heterogeneous. We suggest a revision of the nomenclature in which the lineage and clone are recognized through name and ST designations in accordance with the clonal structure of the population.
Figures
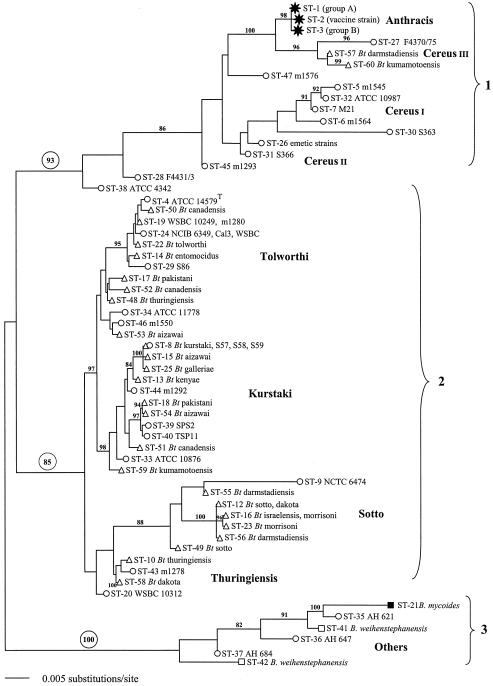
 , B. anthracis; ○, B. cereus; ▵, B. thuringiensis; ▪, B. mycoides; □, B. weihenstephanensis. All horizontal branch lengths were drawn to a scale of substitutions per site, and the tree was rooted at the midpoint for the purpose of clarity only. All bootstrap support values of >80% are shown next to the appropriate nodes. The 85% bootstrap value associated with clade 2 excludes the highly divergent ST-9 type.
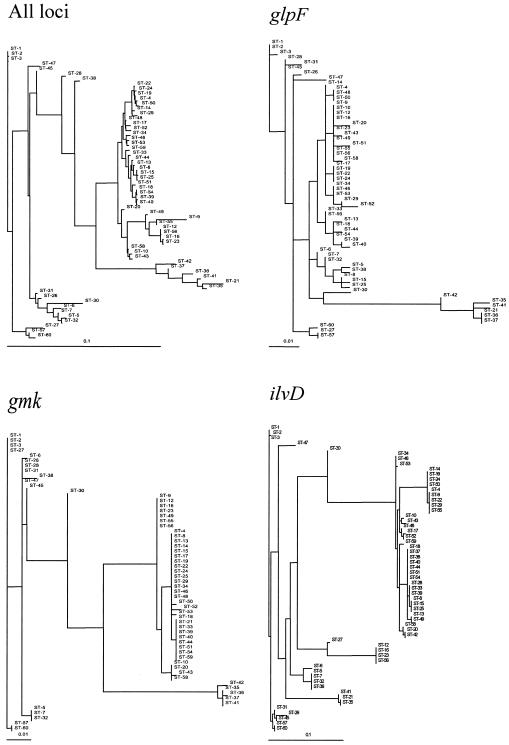
References
-
- Ankarloo, J., D. A. Caugant, B. M. Hansen, A. Berg, A.-B. Kolstø, and A. Lovgren. 2000. Genome stability of Bacillus thuringiensis subsp. israelensis isolates. Curr. Microbiol. 40:51-56. - PubMed
-
- Ash, C., and M. D. Collins. 1992. Comparative analysis of 23S ribosomal RNA gene sequences of Bacillus anthracis and emetic Bacillus cereus determined by PCR-direct sequencing. FEMS Microbiol. Lett. 73:75-80. - PubMed
-
- Ash, C., J. A. Farrow, M. Dorsch, E. Stackebrandt, and M. D. Collins. 1991. Comparative analysis of Bacillus anthracis, Bacillus cereus, and related species on the basis of reverse transcriptase sequencing of 16S rRNA. Int. J. Syst. Bacteriol. 41:343-346. - PubMed
-
- Carlson, C. R., T. Johansen, and A.-B. Kolstø. 1996. The chromosome map of Bacillus thuringiensis subsp. canadensis HD224 is highly similar to that of Bacillus cereus type strain ATCC 14579. FEMS Microbiol. Lett. 141:163-167. - PubMed
MeSH terms
Grants and funding
LinkOut - more resources
Full Text Sources
Other Literature Sources
Molecular Biology Databases
Miscellaneous
