. 2004 Dec;186(23):8074-82.
doi: 10.1128/JB.186.23.8074-8082.2004.

Crystal structure of the PdxY Protein from Escherichia coli

Affiliations

Crystal structure of the PdxY Protein from Escherichia coli

Martin K Safo et al. J Bacteriol. 2004 Dec.

Abstract

The crystal structure of Escherichia coli PdxY, the protein product of the pdxY gene, has been determined to a 2.2-A resolution. PdxY is a member of the ribokinase superfamily of enzymes and has sequence homology with pyridoxal kinases that phosphorylate pyridoxal at the C-5' hydroxyl. The protein is a homodimer with an active site on each monomer composed of residues that come exclusively from each respective subunit. The active site is filled with a density that fits that of pyridoxal. In monomer A, the ligand appears to be covalently attached to Cys122 as a thiohemiacetal, while in monomer B it is not covalently attached but appears to be partially present as pyridoxal 5'-phosphate. The presence of pyridoxal phosphate and pyridoxal as ligands was confirmed by the activation of aposerine hydroxymethyltransferase after release of the ligand by the denaturation of PdxY. The ligand, which appears to be covalently attached to Cys122, does not dissociate after denaturation of the protein. A detailed comparison (of functional properties, sequence homology, active site and ATP-binding-site residues, and active site flap types) of PdxY with other pyridoxal kinases as well as the ribokinase superfamily in general suggested that PdxY is a member of a new subclass of the ribokinase superfamily. The structure of PdxY also permitted an interpretation of work that was previously published about this enzyme.


Figures

FIG. 1.
FIG. 1.
Ribbon diagram of PdxY fold. (A and B) Orthogonal views of the monomeric structure. The right view is rotated 90° from the left view. α-Helices and β-strands are shown in yellow and red, respectively. The secondary structures are labeled. The bound putative PL molecule is shown with magenta spheres. (C) Dimeric structure showing the covalently and noncovalently bound putative PL (blue spheres) at monomer A (yellow) and monomer B (magenta), respectively. The bound sulfate at monomer B is also shown with orange spheres. The figures were generated with Insight II (Molecular Simulations, Inc., San Diego, Calif.) and were labeled with Showcase.
FIG. 2.
FIG. 2.
Multiple sequence alignment of 9 of the 34 putative PL kinases from a sequence homology search with the FASTA program (15). The proteins used for the sequence alignment were as follows (database numbers are shown in parentheses): PdxY, E. coli PdxY (P77150); PdxY-Shigella_flex, Shigella flexneri PdxY (Q83KY1); PdxY-Salmonella_typh, Salmonella enterica serovar Typhimurium PdxY (Q8ZPM8); VV21237-Vibrio_vuln, V. vulnificus VV21237 protein (Q8D4Q2); PdxK-Onion, onion PdxK (BAD04519); PdxK-Sheep, sheep PdxK (P82197); PdxK-Ecoli, E. coli PdxK (P40191); PdxK-Shigella_flex, Shigella flexneri PdxK (Q7UC31); PdxK-Salmonella_typh, Salmonella enterica serovar Typhimurium PdxK (P40192). The sequences PdxY-Shigella_flex, PdxY-Salmonella_typh, and VV21237-Vibrio_vuln have high sequence identities with PdxY (46 to 99%), while the last five sequences have low sequence identities with PdxY (28 to 41%). Shown in red are the conserved active site residues, Gln46, Lys120, Cys122, and Tyr264, in the sequences that have high sequence identities with PdxY. The corresponding nonconserved residues in the other PL kinase members are shown in blue. The figure was generated with ClustalW in the FASTA program (15).
FIG. 3.
FIG. 3.
Spectrum of purified PdxY (2 mg/ml, in 20 mM potassium phosphate, pH 7.3). The solid line shows the spectrum for PdxY between 300 and 420 nm. The dotted line is the spectrum after adding NaOH to 0.1 M, showing the shift of most of the 325-nm peak to one that absorbs at 388 nm, which is characteristic of PLP. Inset, spectrum of PdxY showing both the 278- and 325-nm peaks.
FIG. 4.
FIG. 4.
Stereoviews of electron density map of bound putative PL at the active site of PdxY. (A) 2Fo-Fc map of the covalently bound derivative of PL at monomer A, which was calculated before PL was built into the model. (B) 2Fo-Fc omit map of the covalently bound derivative of PL at monomer A, which was calculated by omitting PL during simulated annealing. (C) 2Fo-Fc map of the noncovalently bound PL at monomer B, which was calculated before PL was built into the model. (D) 2Fo-Fc omit map of the noncovalently bound PL at monomer B, which was calculated by omitting PL during simulated annealing. The maps were contoured at the 1.0σ level and then superimposed with the final refined model. The figures were drawn with Bobscript (6) and Raster3D (12) software and were labeled with Showcase (Silicon Graphics, Inc.).
FIG. 5.
FIG. 5.
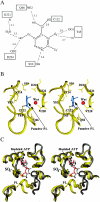
Active site of PdxY. (A) Schematic diagram showing the hydrogen bond interactions between the putative PL and the active site residues of the monomer. Hydrogen bonds are shown as dashed lines, and the observed covalent bond between C-4′ of PL and the SG of Cys122 is shown as a solid line. (B) Stereoview of the putative PL binding site at monomer A. The protein is shown with yellow ribbon figures. The PL and the active site residues are shown as cyan and yellow sticks, respectively. Water molecules are shown as red spheres. The covalent interaction between C-4′ of PL and the SG of Cys122 is shown with a line. For clarity, not all of the active site amino acid residues are shown. (C) Superposition of the active sites of PdxY (yellow) and sheep kinase (gray). ATP, PL, and sulfate molecules are shown with stick models. The ATP in red is the theoretical model for PdxY. The figures were generated with Insight II and labeled with Showcase.

References

    1. Brunger, A. T., P. D. Adams, G. M. Clore, W. L. DeLano, P. Gros, R. W. Grosse-Kunstleve, J. S. Jiang, J. Kuszewski, M. Nilges, N. S. Pannu, R. J. Read, L. M. Rice, T. Simonson, and G. L. Warren. 1998. Crystallography & NMR system: a new software suite for macromolecular structure determination. Acta Crystallogr. D 54:905-921. - PubMed
    1. Cambillau, C., and E. Horjales. 1987. TOM: a Frodo subpackage for protein-ligand fitting with interactive energy minimization. J. Mol. Graph. 5:174-177.
    1. Campobasso, N., I. I. Mathews, T. P. Begley, and S. E. Ealick. 2000. Crystal structure of 4-methyl-5-beta-hydroxyethylthiazole kinase from Bacillus subtilis at 1.5 Å resolution. Biochemistry 39:7868-7877. - PubMed
    1. Cheng, G., E. M. Bennett, T. P. Begley, and S. E. Ealick. 2002. Crystal structure of 4-amino-5-hydroymethyl-2-methylpyrimidine phosphate kinase from Salmonella typhimurium at 2.3 Å resolution. Structure 10:225-235. - PubMed
    1. Di Salvo, M. L., S. Hunt, and V. Schirch. 2004. Expression, purification and kinetic constants for human and Escherichia coli pyridoxal kinases. Protein Expr. Purif. 36:300-306. - PubMed

Publication types

MeSH terms

LinkOut - more resources