

3-O-methylfunicone, a secondary metabolite produced by Penicillium pinophilum, induces growth arrest and apoptosis in HeLa cells
- PMID: 15548174
- PMCID: PMC6495956
- DOI: 10.1111/j.1365-2184.2004.00323.x
3-O-methylfunicone, a secondary metabolite produced by Penicillium pinophilum, induces growth arrest and apoptosis in HeLa cells
Abstract
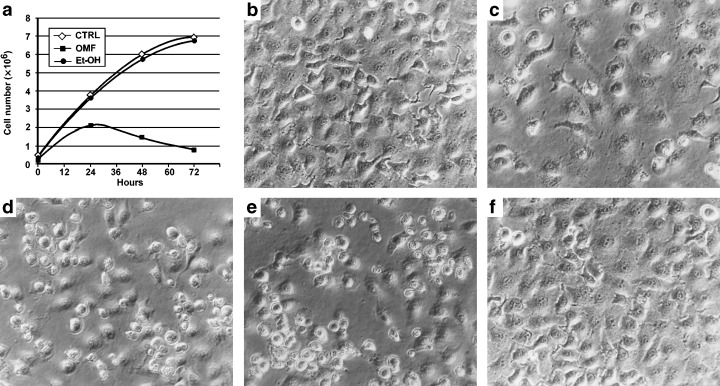
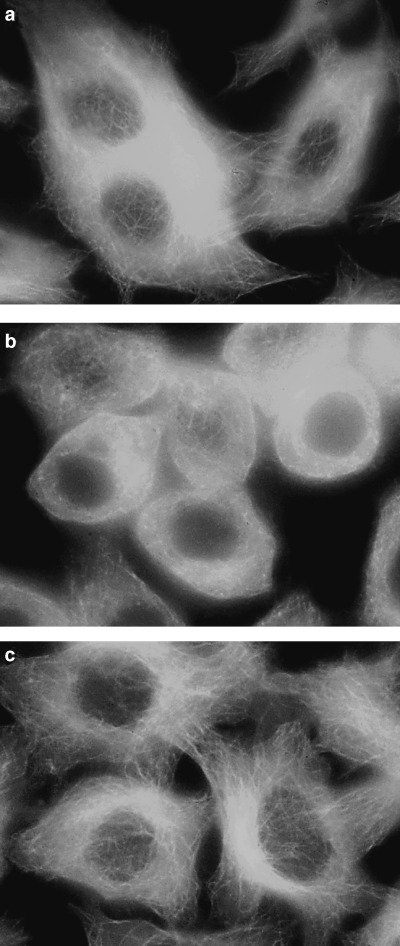
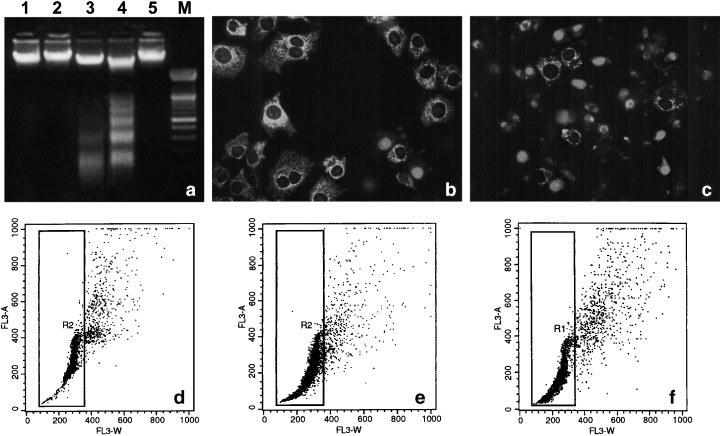
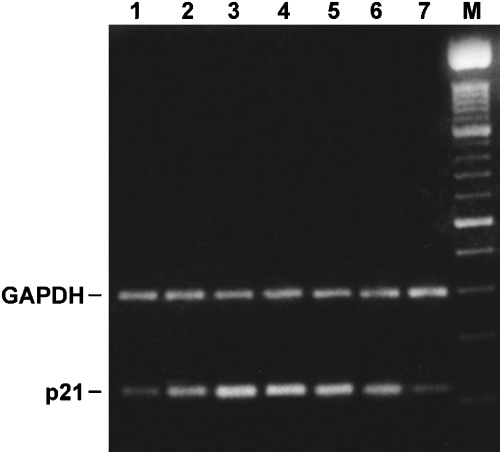
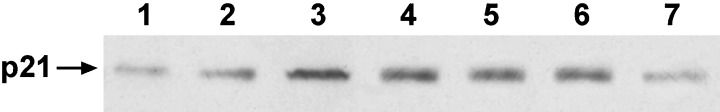
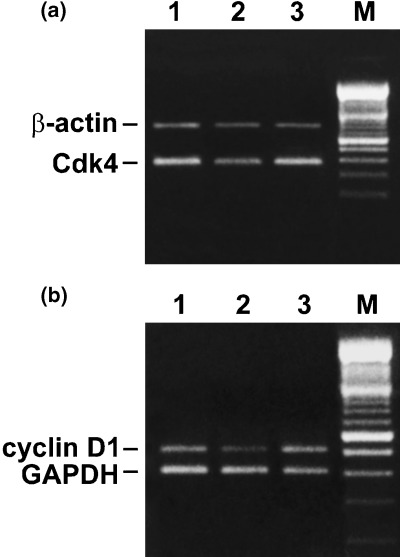
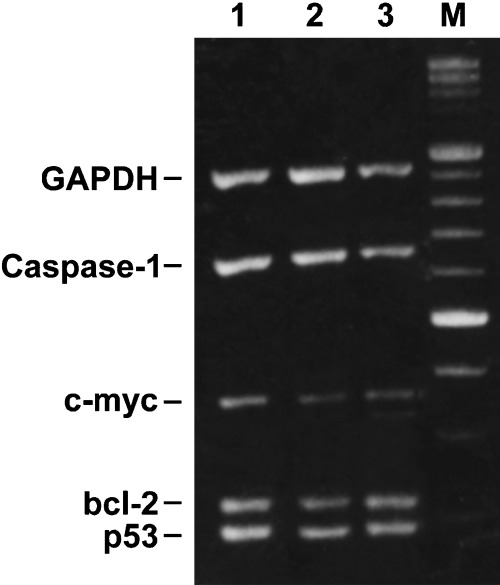
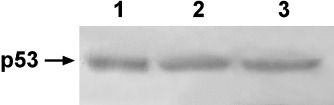
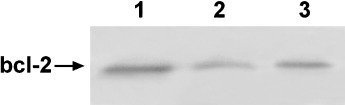
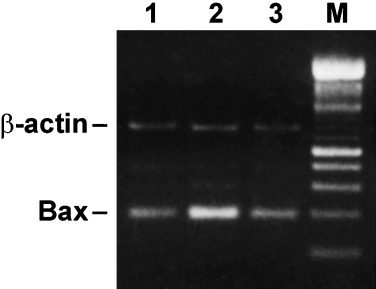
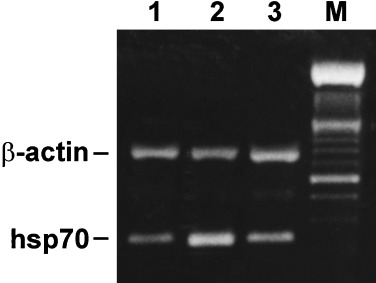
3-O-Methylfunicone (OMF) is a secondary metabolite produced by the soil fungus Penicillium pinophilum which has cytostatic properties. The aim of this study was to investigate the mechanisms by which such properties are exerted, with special reference to any anti-proliferative and apoptotic potential, on HeLa cells. OMF treatment caused about 44% inhibition of cell growth after 24 h, and modifications in the tubulin fibre organization. In addition, a significant increase in p21 mRNA expression and a decrease in cyclin D1 and Cdk4 mRNA expression resulted at the same time. Apoptosis induction was demonstrated by the annexin V assay, cytofluorimetric analysis of the DNA content of the sub-G1 fraction and DNA laddering. Taken together, our data showed that the compound inhibits proliferation of HeLa cells by several mechanisms, such as disruption of tubulin fibres, cell cycle arrest and apoptosis induction. The capacity of the compound to affect the cell cycle and to modulate apoptosis is indicative of a potential for the development of a new agent for cancer chemotherapy.
Figures

Similar articles
-
3-O-methylfunicone, a metabolite of Penicillium pinophilum, inhibits proliferation of human melanoma cells by causing G(2) + M arrest and inducing apoptosis.Cell Prolif. 2009 Aug;42(4):541-53. doi: 10.1111/j.1365-2184.2009.00609.x. Epub 2009 May 22. Cell Prolif. 2009. PMID: 19486013 Free PMC article.
-
Cytostatic properties of a novel compound derived from Penicillium pinophilum: an in vitro study.Altern Lab Anim. 2002 Jan-Feb;30(1):69-75. doi: 10.1177/026119290203000107. Altern Lab Anim. 2002. PMID: 11827571
-
Decreased proliferation and cell cycle arrest in neoplastic rat pituitary cells is associated with transforming growth factor-beta1-induced expression of p15/INK4B.Mol Cell Endocrinol. 2001 May 15;176(1-2):29-37. doi: 10.1016/s0303-7207(01)00477-4. Mol Cell Endocrinol. 2001. PMID: 11369440
-
Resveratrol causes WAF-1/p21-mediated G(1)-phase arrest of cell cycle and induction of apoptosis in human epidermoid carcinoma A431 cells.Clin Cancer Res. 2001 May;7(5):1466-73. Clin Cancer Res. 2001. PMID: 11350919
-
Inhibition of the melanoma cell cycle and regulation at the G1/S transition by 12-O-tetradecanoylphorbol-13-acetate (TPA) by modulation of CDK2 activity.Exp Cell Res. 1995 Nov;221(1):92-102. doi: 10.1006/excr.1995.1356. Exp Cell Res. 1995. PMID: 7589260
Cited by
-
Bioactive Compounds Produced by Strains of Penicillium and Talaromyces of Marine Origin.Mar Drugs. 2016 Feb 18;14(2):37. doi: 10.3390/md14020037. Mar Drugs. 2016. PMID: 26901206 Free PMC article. Review.
-
Anticancer and antifungal compounds from Aspergillus, Penicillium and other filamentous fungi.Molecules. 2013 Sep 13;18(9):11338-76. doi: 10.3390/molecules180911338. Molecules. 2013. PMID: 24064454 Free PMC article. Review.
-
Cell-growth and migration inhibition of human mesothelioma cells induced by 3-O-methylfunicone from Penicillium pinophilum and cisplatin.Invest New Drugs. 2012 Aug;30(4):1343-51. doi: 10.1007/s10637-011-9698-1. Epub 2011 Jun 9. Invest New Drugs. 2012. PMID: 21656164
-
Occurence and bioactivities of funicone-related compounds.Int J Mol Sci. 2009 Mar 30;10(4):1430-1444. doi: 10.3390/ijms10041430. Int J Mol Sci. 2009. PMID: 19468317 Free PMC article. Review.
-
Production and fungitoxic activity of Sch 642305, a secondary metabolite of Penicillium canescens.Mycopathologia. 2007 May;163(5):295-301. doi: 10.1007/s11046-007-9015-x. Epub 2007 Apr 12. Mycopathologia. 2007. PMID: 17429757
References
-
- Alagesaboopathi C (1994) Biological control of damping‐off disease of cotton seedling. Curr. Sci. 66, 865.
-
- Barrett JC, Annab LA, Alcorta D, Preston G, Vojta P, Yin Y (1994) Cellular senescence and cancer. Cold Spring Harb. Symp. Quant. Biol. 59, 411. - PubMed
-
- Damayanthi Y, Lown JW (1998) Podophyllotoxins: current status and recent developments. Curr. Med. Chem. 5, 205. - PubMed
-
- De Stefano S, Nicoletti R, Milone A, Zambardino S (1999) 3‐O‐Methylfunicone, a fungitoxic metabolite produced by the fungus Penicillium pinophilum . Phytochemistry 52, 1399.
-
- Dhedhi BM, Gupta O, Patel VA (1990) Antagonistic effect of microorganisms to Fusarium oxysporum f.sp. ciceri . Indian J. Mycol. Plant Pathol. 20, 70.
Publication types
MeSH terms
Substances
LinkOut - more resources
Full Text Sources
Other Literature Sources
Research Materials
