

The "Transport Specificity Ratio": a structure-function tool to search the protein fold for loci that control transition state stability in membrane transport catalysis
- PMID: 15548327
- PMCID: PMC535561
- DOI: 10.1186/1471-2091-5-16
The "Transport Specificity Ratio": a structure-function tool to search the protein fold for loci that control transition state stability in membrane transport catalysis
Abstract
Background: In establishing structure-function relationships for membrane transport proteins, the interpretation of phenotypic changes can be problematic, owing to uncertainties in protein expression levels, sub-cellular localization, and protein-folding fidelity. A dual-label competitive transport assay called "Transport Specificity Ratio" (TSR) analysis has been developed that is simple to perform, and circumvents the "expression problem," providing a reliable TSR phenotype (a constant) for comparison to other transporters.
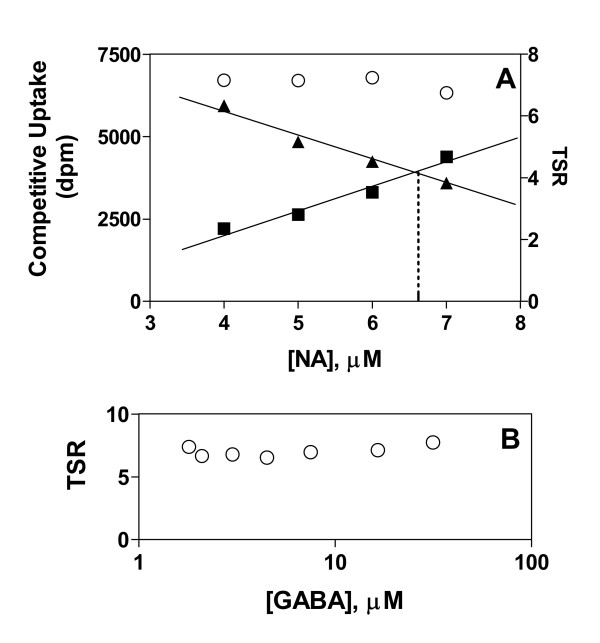
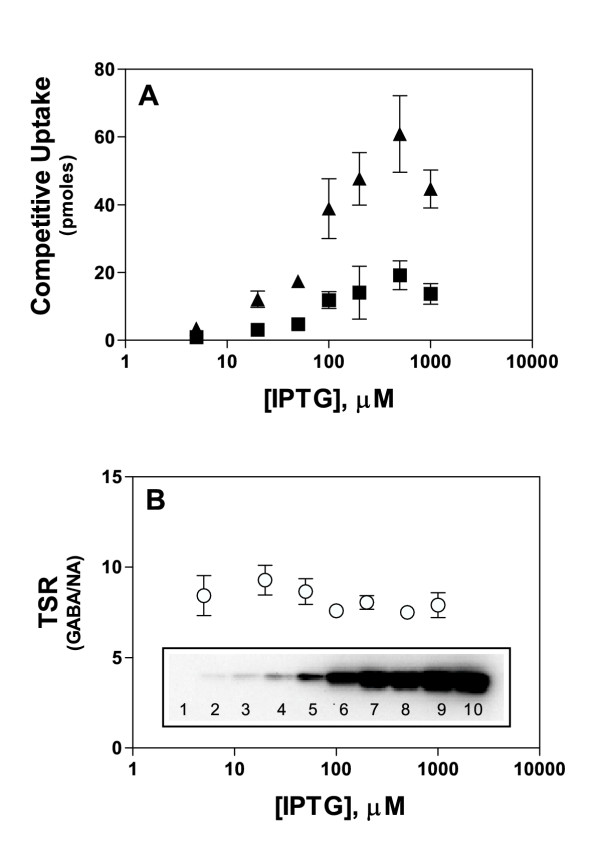
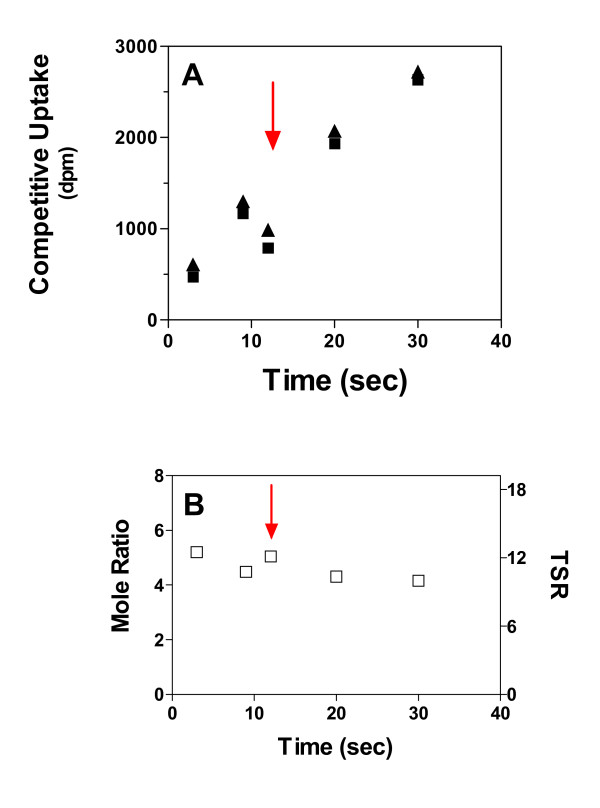
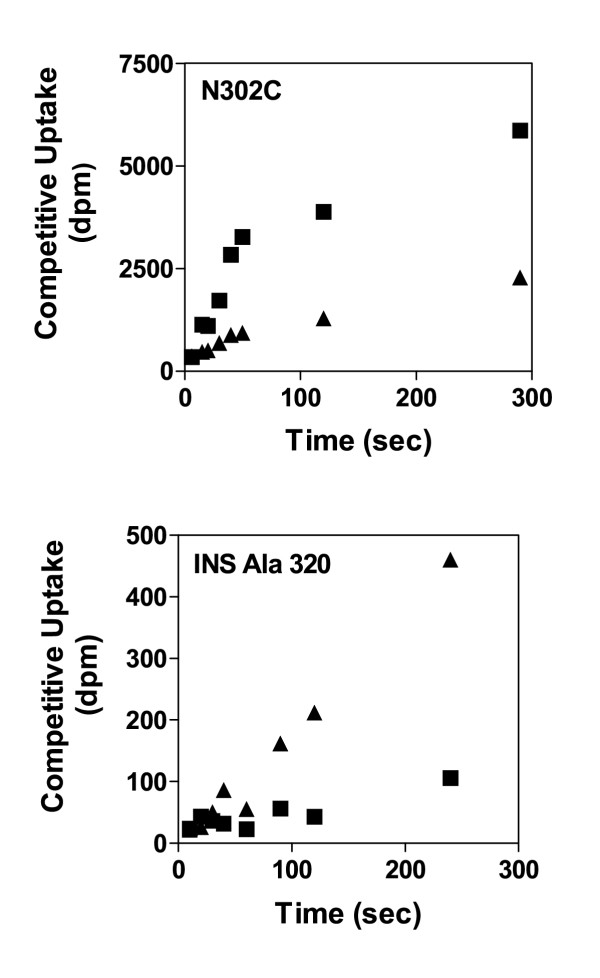
Results: Using the Escherichia coli GABA (4-aminobutyrate) permease (GabP) as a model carrier, it is demonstrated that the TSR phenotype is largely independent of assay conditions, exhibiting: (i) indifference to the particular substrate concentrations used, (ii) indifference to extreme changes (40-fold) in transporter expression level, and within broad limits (iii) indifference to assay duration. The theoretical underpinnings of TSR analysis predict all of the above observations, supporting that TSR has (i) applicability in the analysis of membrane transport, and (ii) particular utility in the face of incomplete information on protein expression levels and initial reaction rate intervals (e.g., in high-throughput screening situations). The TSR was used to identify gab permease (GabP) variants that exhibit relative changes in catalytic specificity (kcat/Km) for [14C]GABA (4-aminobutyrate) versus [3H]NA (nipecotic acid).
Conclusions: The TSR phenotype is an easily measured constant that reflects innate molecular properties of the transition state, and provides a reliable index of the difference in catalytic specificity that a carrier exhibits toward a particular pair of substrates. A change in the TSR phenotype, called a Delta(TSR), represents a specificity shift attributable to underlying changes in the intrinsic substrate binding energy (DeltaGb) that translocation catalysts rely upon to decrease activation energy (Delta G(T)(++). TSR analysis is therefore a structure-function tool that enables parsimonious scanning for positions in the protein fold that couple to the transition state, creating stability and thereby serving as functional determinants of catalytic power (efficiency, or specificity).
Figures
 ) does not depend on a favourable protein-substrate interaction in the transition state, (ii) the catalysed translocation energy barrier is taken as the Gibbs Energy difference (
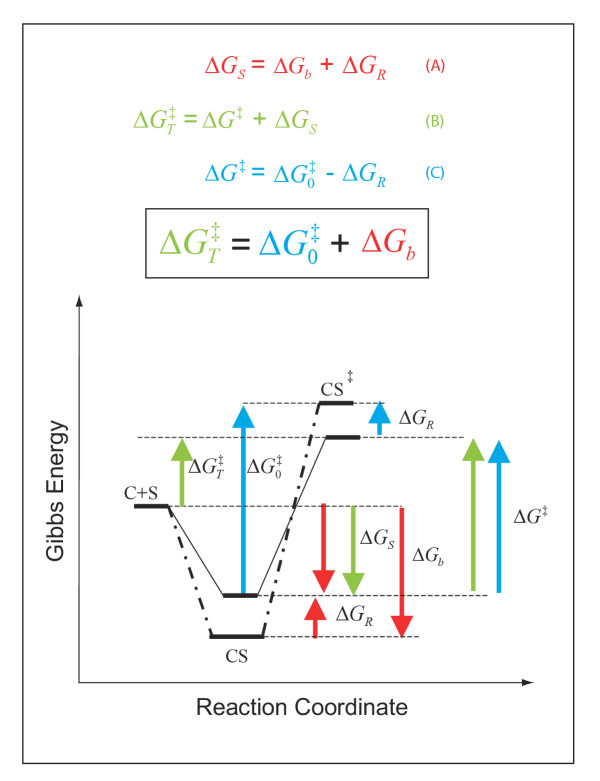
 ) between the free reactants (C + S) and the transition state complex (CS‡), and (iii) intrinsic substrate binding energy is recognizable as the decisive factor in transition state stabilization. Thus, translocation catalysts (C) will use intrinsic substrate binding energy (ΔGb) to stabilize the transition state (CS‡). The role of ΔGb in lowering the transition state energy barrier compared to a non-catalyzed reaction () may be deduced with aid from the accompanying energy diagrams, which emphasize several instances wherein the thermodynamic distance represented by one coloured arrow equals the summed distance represented by two shorter arrows of the same colour. The illustrated thermodynamic relationships are restated (with proper attention to sign convention) in equations A (red), B (green), and C (blue). Substituting A and C into B yields the fundamental relationship,
  (boxed), which says that the uncatalysed activation energy (, algebraically positive) is diminished by intrinsic substrate binding energy, ΔGb (algebraically negative), which is the underlying parameter that TSR analysis probes (Eqn. 9). Note: These energy diagrams compare non-catalytic (dots and dashes) and catalytic (solid line) proteins. Imposition of a binding-averse interaction (ΔGR) is seen to de-stabilize the Michaelis complex (CS, red arrows) in the catalytic protein. Subsequent attainment of favourable transition state complementarity (i.e., via conformational transitions that relieve ΔGR , blue arrows) results in use of binding energy to stabilize the transition state complex (CS‡). This internal ''give-and-take,'' involving ΔGR is reflected in its algebraic cancellation when equations A, B, and C are combined to yield the boxed equation (text Eqn. 1), which says that intrinsic substrate binding energy decreases the energy barrier () for a translocation reaction carried out from solution (i.e., directly from the free carrier and substrate (C + S) to the transition state). When C and S are free in solution, the effective second-order rate constant associated with is kcat/Km, the specificity parameter compared in the dual-substrate TSR analysis (Equation.5). That kcat/Km should be associated with the free reactants may be appreciated by considering the Michaelis-Menten Equation when S << Km, and CS complexes do not exist in appreciable amounts (see Discussion).
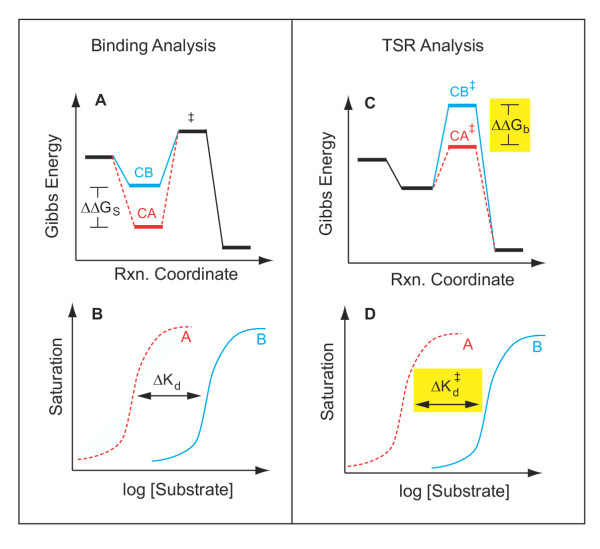
 (Panel D, yellow), for the "impossible experiment" on substrate binding to the unstable transition state. Thus, observation of a Δ(TSR) phenotype reflects underlying structural changes that affect binding discrimination between substrates A and B in the transition state, which are of interest because transition state binding interactions create transport catalysis [2–4, 7] by lowering the activation energy, , and increasing kcat/Km. In summary, the equilibrium binding experiment depicted on the left does not address catalysis per se, whereas the TSR experiment depicted on the right does.
Similar articles
-
Use of the transport specificity ratio and cysteine-scanning mutagenesis to detect multiple substrate specificity determinants in the consensus amphipathic region of the Escherichia coli GABA (gamma-aminobutyric acid) transporter encoded by gabP.Biochem J. 2003 Dec 15;376(Pt 3):633-44. doi: 10.1042/BJ20030594. Biochem J. 2003. PMID: 12956624 Free PMC article.
-
Induction of substrate specificity shifts by placement of alanine insertions within the consensus amphipathic region of the Escherichia coli GABA (gamma-aminobutyric acid) transporter encoded by gabP.Biochem J. 2003 Dec 15;376(Pt 3):645-53. doi: 10.1042/BJ20030595. Biochem J. 2003. PMID: 12956623 Free PMC article.
-
Pyridine carboxylic acids as inhibitors and substrates of the Escherichia coli gab permease encoded by gabP.J Bacteriol. 1995 Sep;177(18):5381-2. doi: 10.1128/jb.177.18.5381-5382.1995. J Bacteriol. 1995. PMID: 7665533 Free PMC article.
-
4-Aminobutyrate (GABA) transporters from the amine-polyamine-choline superfamily: substrate specificity and ligand recognition profile of the 4-aminobutyrate permease from Bacillus subtilis.Biochem J. 1998 Aug 1;333 ( Pt 3)(Pt 3):565-71. doi: 10.1042/bj3330565. Biochem J. 1998. PMID: 9677314 Free PMC article.
-
Structure-stability relationship in proteins: fundamental tasks and strategy for the development of stabilized enzyme catalysts for biotechnology.CRC Crit Rev Biochem. 1988;23(3):235-81. doi: 10.3109/10409238809088225. CRC Crit Rev Biochem. 1988. PMID: 3069328 Review.
Cited by
-
Sodium-dependent extracellular accessibility of Lys-84 in the sodium/dicarboxylate cotransporter.J Biol Chem. 2007 Jul 13;282(28):20213-20. doi: 10.1074/jbc.M701113200. Epub 2007 May 15. J Biol Chem. 2007. PMID: 17504760 Free PMC article.
-
Transmembrane helix 7 in the Na+/dicarboxylate cotransporter 1 is an outer helix that contains residues critical for function.Biochim Biophys Acta. 2011 Jun;1808(6):1454-61. doi: 10.1016/j.bbamem.2010.11.007. Epub 2010 Nov 10. Biochim Biophys Acta. 2011. PMID: 21073858 Free PMC article.
-
Role of isoleucine-554 in lithium binding by the Na+/dicarboxylate cotransporter NaDC1.Biochemistry. 2010 Oct 19;49(41):8937-43. doi: 10.1021/bi100600j. Biochemistry. 2010. PMID: 20845974 Free PMC article.
-
Determinants of substrate and cation transport in the human Na+/dicarboxylate cotransporter NaDC3.J Biol Chem. 2014 Jun 13;289(24):16998-7008. doi: 10.1074/jbc.M114.554790. Epub 2014 May 7. J Biol Chem. 2014. PMID: 24808185 Free PMC article.
-
Independent and simultaneous translocation of two substrates by a nucleotide sugar transporter.Proc Natl Acad Sci U S A. 2006 Oct 31;103(44):16176-81. doi: 10.1073/pnas.0608159103. Epub 2006 Oct 23. Proc Natl Acad Sci U S A. 2006. PMID: 17060606 Free PMC article.
References
-
- Jencks WP. Binding energy, specificity, and enzymic catalysis: the Circe effect. Adv Enzymol. 1975;43:219–410. - PubMed
-
- Krupka RM. Role of substrate binding forces in exchange-only transport systems: I. Transition-state theory. J Membr Biol. 1989;109:151–158. - PubMed
-
- Petsko GA, Ringe D. Protein Structure and Function. London, New Science Press; 2004. Stabilization of Transition States and Exclusion of Water; p. 68.
-
- King SC, Brown-Istvan L. Use of the "Transport Specificity Ratio" and Cysteine-Scanning Mutagenesis to Identify Multiple Substrate Specificity Determinants within the "Consensus Amphipathic Region" of the Escherichia coli GABA Transporter encoded by gabP. Biochem J. 2003;376:633–644. doi: 10.1042/BJ20030594. - DOI - PMC - PubMed
Publication types
MeSH terms
Substances
Grants and funding
LinkOut - more resources
Full Text Sources
Miscellaneous
