. 2004 Sep-Oct;6(5):490-502.
doi: 10.1593/neo.04124.

Gene expression profiling of mouse teratocarcinomas uncovers epigenetic changes associated with the transformation of mouse embryonic stem cells

Affiliations

Gene expression profiling of mouse teratocarcinomas uncovers epigenetic changes associated with the transformation of mouse embryonic stem cells

Allison E Bonner et al. Neoplasia. 2004 Sep-Oct.

Abstract

The molecular mechanisms of the development of teratocarcinomas from stem cells are largely unknown. To determine which genes are associated with the transformation of these cells, we have performed oligonucleotide microarray analysis, using Affymetrix U74A GeneChips, on both cell cultures and tumors in nude mice. We identified 68 genes that significantly differed in expression between the ES cell culture and the teratocarcinoma cell line, SCC-PSA1, and 51 genes with statistically different expression patterns between the ES cell tumors and the teratocarcinomas (P < .00005). We found that there were 20 genes that had common expression patterns in both groups. We also examined the role of the transition from in vitro to in vivo by comparing ES cell culture to ES cell tumor, and teratocarcinoma cell line to teratocarcinomas. We identified 22 genes that were upregulated in the ES cell tumors and 42 that had a decreased expression in the tumor (P < .0001). In comparing SCC-PSA1 to its tumor, we identified 34 upregulated genes and 25 downregulated genes (P < .001). There were only 10 genes in common from these two lists. GenMapp search revealed that several pathways, especially the cell cycle pathway, are actively involved in the induction of teratocarcinomas. Our results indicate that many key development genes may play a key role in the transformation of ES cells into teratocarcinoma cells.


Figures

Figure 1
Figure 1
Characterization of teratocarcinoma tumor growth referenced to ES cell tumor growth. (A) Representative tumors in situ. About 5 x 10⁵ ES cells were injected on the left flank of the mice and 5 x 10⁵ SCC-PSA1 (teratocarcinoma) cells were injected on the right flank. (B) Resected tumors. Representative tumors from the nude mouse experiment were resected and photographed. Centimeter ruler to the right to indicate tumor size. (C) Differential growth of the ES cell tumors and teratocarcinomas (P < .05). The orange bar represents average teratocarcinoma growth; the blue bar represents ES cell growth. Tumor weight in grams is on the Y-axis. (D) Hematoxylin and eosin (H&E) staining of section of resected tumors. This area demonstrates the tissue types of (★) glandular epithelium, (▲) squamous epithelium, and (♦) mature skeletal tissues, which were similar in both the ES cell tumors and the teratocarcinomas. (E) H&E staining of another portion of tissue, immature neuroepithelial rosettes, similar in both tumor types. (F) H&E- stained section from a teratocarcinoma demonstrating the areas of necrosis and frequent mitotic figures, which is unique to the teratocarcinomas.
Figure 2
Figure 2
Karyotype analysis of SCC-PSA1 cell line. (A) Representative metaphase spread for the SCC-PSA1 cell line. Twenty separate metaphase spreads were examined and no detectable numerical abnormalities were found. (B) Representative karyotype of SCC-PSA1 cell line. A normal karyotype of 38 autosomes and 2 sex chromosomes was seen in all 20 of the cells examined. No apparent chromosomal abnormalities were identified. Note: The computer program used to display the karyotype is intended for human karyotypes, leading to the excess of numbers that do not correspond to any murine chromosomes.
Figure 3
Figure 3
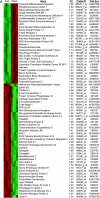
Global expression changes of the transformation of teratocarcinoma cell from ES cells. (A) Cells in culture: a comparison of ESC versus TERC (P < .00005). Red indicates expression higher than the mean value. Green indicates expression below the mean value. Black indicates a value near the mean. Gene name is indicated to the right of the colored diagram. FC—fold change between the average expression values for the two groups being compared; Probe ID—Affymetrix probe identification number; Pub Acc—public accession number corresponding to the gene sequence used to generate the Affymetrix probe. (B) Tumors: a comparison of ES versus TER (P < .00005). Color scheme and labels identical to that described in Figure 4A.
Figure 3
Figure 3
Global expression changes of the transformation of teratocarcinoma cell from ES cells. (A) Cells in culture: a comparison of ESC versus TERC (P < .00005). Red indicates expression higher than the mean value. Green indicates expression below the mean value. Black indicates a value near the mean. Gene name is indicated to the right of the colored diagram. FC—fold change between the average expression values for the two groups being compared; Probe ID—Affymetrix probe identification number; Pub Acc—public accession number corresponding to the gene sequence used to generate the Affymetrix probe. (B) Tumors: a comparison of ES versus TER (P < .00005). Color scheme and labels identical to that described in Figure 4A.
Figure 4
Figure 4
An examination of the expression changes associated with the transition from in vitro to in vivo. (A) The expression of genes in ES cells in culture compared to the expression of genes in ES cell tumors induced in nude mice (P < .001). Labeling and color scheme identical to that described in (A). (B) The expression of genes in teratocarcinoma cells in culture compared to teratocarcinomas induced in nude mice. Labeling and color scheme identical to that described in (A).
Figure 4
Figure 4
An examination of the expression changes associated with the transition from in vitro to in vivo. (A) The expression of genes in ES cells in culture compared to the expression of genes in ES cell tumors induced in nude mice (P < .001). Labeling and color scheme identical to that described in (A). (B) The expression of genes in teratocarcinoma cells in culture compared to teratocarcinomas induced in nude mice. Labeling and color scheme identical to that described in (A).
Figure 5
Figure 5
Real-time RT-PCR analysis of several genes of interest compared to the microarray expression analysis. ES cell tumor data (ES) are compared to teratocarcinoma data (TER) for both microarray data (dark orange) and real-time RT-PCR (light orange). Also included are data from the ES cell culture (ESC) versus teratocarcinoma cell culture (TERC) for both microarray data (dark blue) and real-time RT-PCR data (light blue). Gene name is on the X-axis and fold change is on the Y-axis. Real-time PCR was performed on two samples and the value presented is the average of the two samples (with a variation of less than 10%).
Figure 6
Figure 6
(A) Similarities between the expression patterns of genes with differential expression between ES cell culture and teratocarcinoma cell culture, as well as ES cell tumor and teratocarcinoma. Labeling and color scheme identical to that described in Figure 4A. FCC—fold change between the average expression values for ES cells versus the teratocarcinoma cells in culture; FCT—fold change between the average expression values for ES cell tumors versus teratocarcinomas. (B) Similarities between the expression patterns of genes with differential expression between the cell cultures and the tumors for both the ES cell and the teratocarcinoma cells. Labeling and color scheme identical to that described in Figure 4A. FC ES—fold change between the average expression values for ES cell cultures versus the ES cell tumors. FCT—fold change between the average expression values for teratocarcinoma cell cultures versus the teratocarcinomas.
Figure 7
Figure 7
GenMAPP Cell cycle pathways integrating our expression data (cutoff: fold change >1.5 or < 0.75 in ES tumors versus TER tumors). Red indicates overexpressed genes in ES tumors. Blue indicates overexpressed genes in TER tumors. Grey indicates that the selection criteria were not met but the gene is represented on the array. White boxes indicate that the gene was not present on the chip. *The gene has fold change >1.5 or <0.75 in ES tumors versus TER tumors with P V .05.

References

    1. Mintz B, Fleischman RA. Teratocarcinomas and other neoplasms as developmental defects in gene expression. Adv Cancer Res. 1981;34:211–278. - PubMed
    1. Stevens LC. The development of transplantable teratocarcinomas from intratesticular grafts of pre- and postimplantation mouse embryos. Dev Biol. 1970;21:364–382. - PubMed
    1. Lockhart DJ, Dong H, Byrne MC, Follettie MT, Gallo MV, Chee MS, Mittmann M, Wang C, Kobayashi M, Horton H, Brown EL. Expression monitoring by hybridization to high-density oligonucleotide arrays. Nat Biotechnol. 1996;14(13):1675–1680. - PubMed
    1. Wodicka L, Dong H, Mittmann M, Ho MH, Lockhart DJ. Genome-wide expression monitoring in Saccharomyces cerevisiae. Nat Biotechnol. 1997;15(13):1359–1367. - PubMed
    1. Lemon WJ, Palatini JJ, Krahe R, Wright FA. Theoretical and experimental comparisons of gene expression indexes for oligonucleotidearrays. Bioinformatics. 2002;18(11):1470–1476. - PubMed