. 2005 Feb;16(2):701-16.
doi: 10.1091/mbc.e04-09-0827. Epub 2004 Nov 17.

Fractionation of the epithelial apical junctional complex: reassessment of protein distributions in different substructures

Affiliations

Fractionation of the epithelial apical junctional complex: reassessment of protein distributions in different substructures

Roger Vogelmann et al. Mol Biol Cell. 2005 Feb.

Abstract

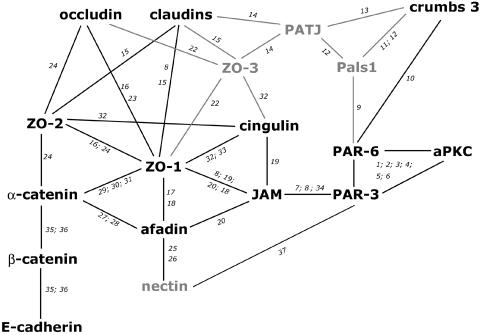
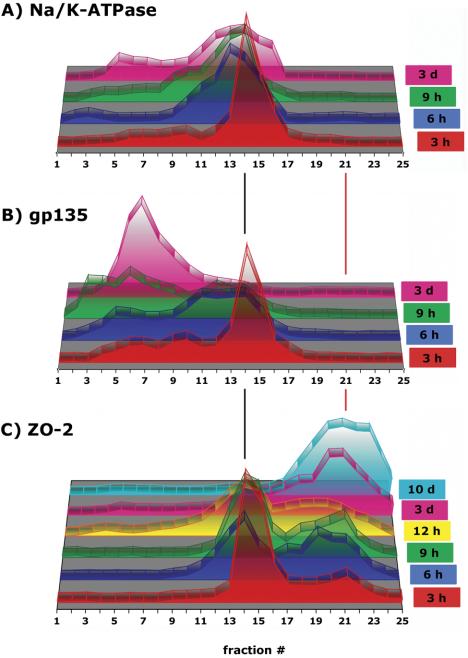
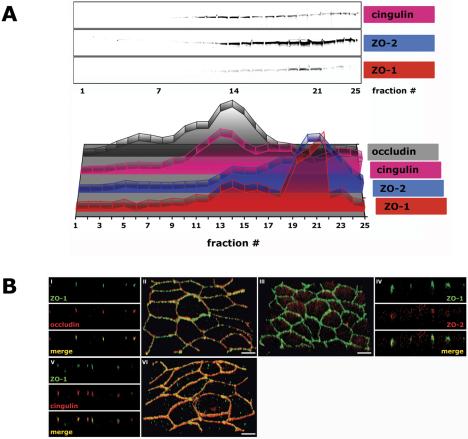
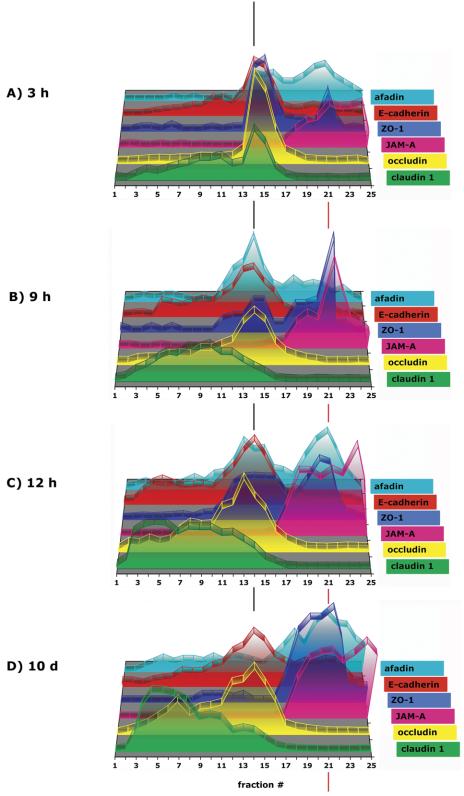
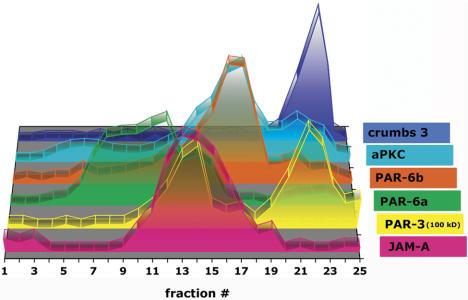
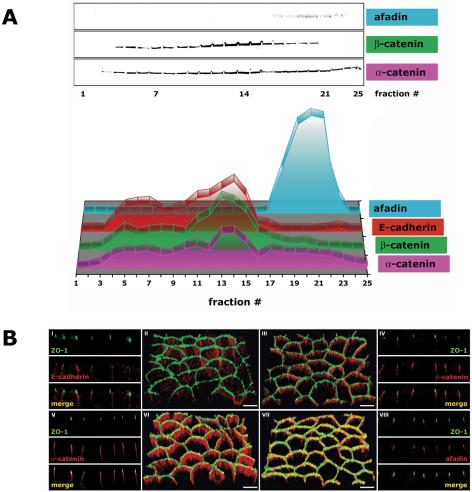
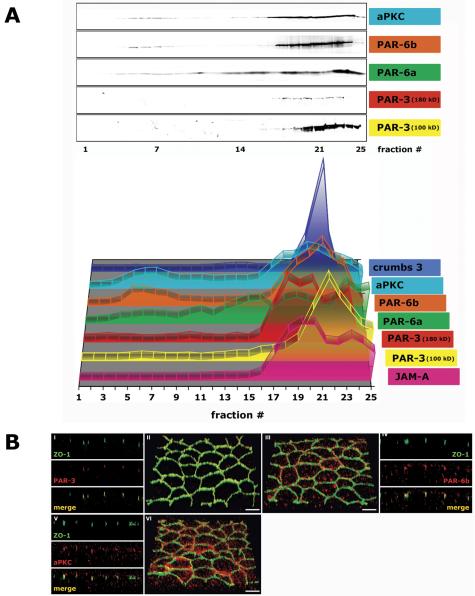
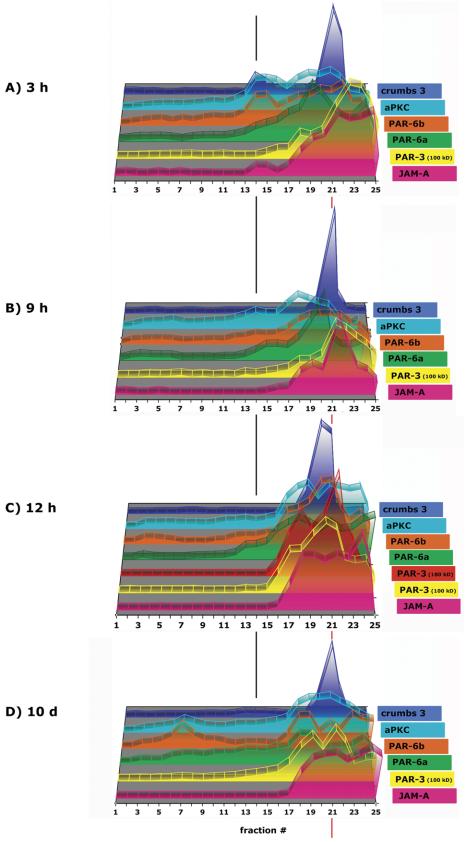
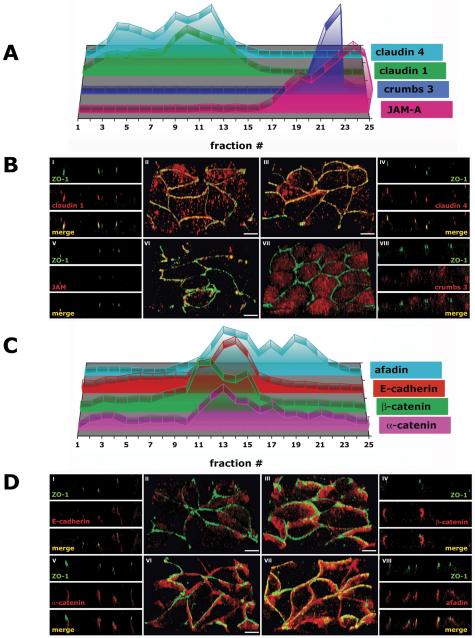
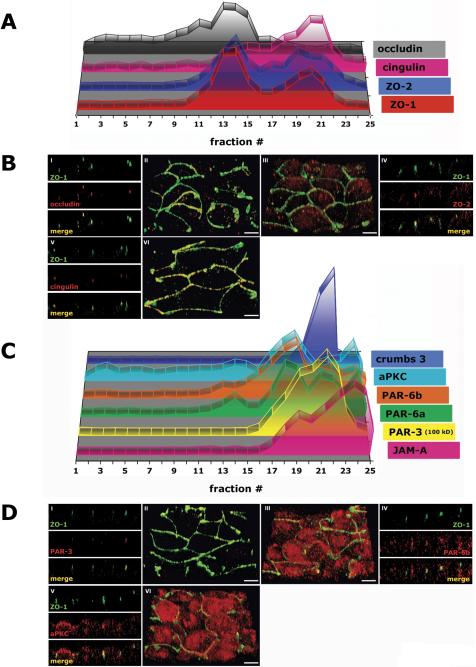
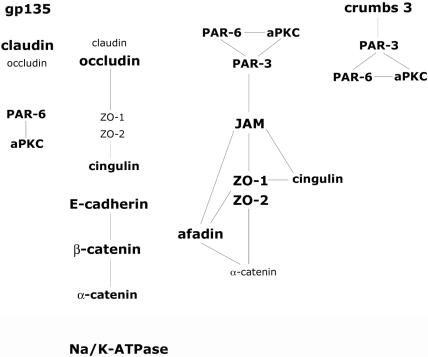
The epithelial apical junctional complex (AJC) is an important regulator of cell structure and function. The AJC is compartmentalized into substructures comprising the tight and adherens junctions, and other membrane complexes containing the membrane proteins nectin, junctional adhesion molecule, and crumbs. In addition, many peripheral membrane proteins localize to the AJC. Studies of isolated proteins indicate a complex map of potential binding partners in which there is extensive overlap in the interactions between proteins in different AJC substructures. As an alternative to a direct search for specific protein-protein interactions, we sought to separate membrane substructures of the AJC in iodixanol density gradients and define their protein constituents. Results show that the AJC can be fractured into membrane substructures that contain specific membrane and peripheral membrane proteins. The composition of each substructure reveals a more limited overlap in common proteins than predicted from the inventory of potential interactions; some of the overlapping proteins may be involved in stepwise recruitment and assembly of AJC substructures.


Figures

Figure 1.
Figure 1.
Protein-protein interaction map (proteins analyzed in this study in black). Numbers represent reference to previous studies: 1, Izumi et al. (1998); 2, Joberty et al. (2000); 3, Lin et al. (2000); 4, Suzuki et al. (2001); 5, Johansson et al. (2000); 6, Qiu et al. (2000); 7, Ebnet et al. (2001); 8, Itoh et al. (2001); 9, Hurd et al. (2003); 10, Lemmers et al. (2004); 11, Makarova et al. (2003); 12, Roh et al. (2002b); 13, Lemmers et al. (2002); 14, Roh et al. (2002a); 15, Itoh et al. (1999a); 16, Fanning et al. (1998); 17, Yamamoto et al. (1997); 18, Fukuhara et al. (2002); 19, Bazzoni et al. (2000); 20, Ebnet et al. (2000); 22, Haskins et al. (1998); 23, Furuse et al. (1994); 24, Itoh et al. (1999b); 25, Takahashi et al. (1999); 26, Reymond et al. (2001); 27, Tachibana et al. (2000); 28, Pokutta et al. (2002); 29, Itoh et al. (1991); 30, Itoh et al. (1997); 31, Imamura et al. (1999); 32, Cordenonsi et al. (1999); 33, D'Atri et al. (2002); 34, Ebnet et al. (2003); 35, Aberle et al. (1994); 36, Jou et al. (1995); 37, Takekuni et al. (2003).
Figure 9.
Figure 9.
Distribution of proteins in 10-20-30% iodixanol gradients during formation of AJC. MDCK cells were grown as confluent monolayers on Transwell filters for time points indicated after cell-cell adhesion. After separation of fraction samples by SDS-PAGE followed by immunoblotting, signal intensity for each protein band was determined as integrated intensity (counts/mm2) and expressed as percentage of the sum of integrated intensities in fractions 1-25 (see Materials and Methods for details). In the 3-D graph, the y-axis (arbitrary units) is omitted to increase clarity of the graphical display.
Figure 3.
Figure 3.
Tight junction proteins of the AJC in polarized epithelia (3 d after cell-cell adhesion). MDCK cells were grown as confluent monolayers on Transwell filters for 3 d after cell-cell adhesion. (A) 10-20-30% iodixanol gradient. Signal intensity for each protein band was determined as integrated intensity (counts/mm2) and expressed as percentage of the sum of integrated intensities in fractions 1-25 (see Materials and Methods for details). In the 3-D graph, the y-axis (arbitrary units) is omitted to increase clarity of the graphical display. (B) Immunofluorescence. II/III/VI are 3-D reconstructions of confocal z-stacks in a 45°-angled view. I/IV/V are z-sections of corresponding 3-D reconstructions. Bar, 5 μm.
Figure 2.
Figure 2.
Transmembrane proteins of the AJC in polarized epithelia (3 d after cell-cell adhesion). MDCK cells were grown as confluent monolayers on Transwell filters for 3 d after cell-cell adhesion. (A) 10-20-30% iodixanol gradient. Signal intensity for each protein band was determined as integrated intensity (counts/mm2) and expressed as percentage of the sum of integrated intensities in fractions 1-25 (see Materials and Methods for details). In the 3-D graph, the y-axis (arbitrary units) is omitted to increase clarity of the graphical display. (B) Immunofluorescence. II/III/VI/VII are 3-D reconstructions of confocal z-stacks in a 45°-angled view. I/IV/V/VIII are z-sections of corresponding 3-D reconstructions. Bar, 5 μm.
Figure 10.
Figure 10.
Formation of AJC in 10-20-30% iodixanol gradients. MDCK cells were grown as confluent monolayers on Transwell filters for time points indicated after cell-cell adhesion. After separation of fraction samples by SDS-PAGE followed by immunoblotting, signal intensity for each protein band was determined as integrated intensity (counts/mm2) and expressed as percentage of the sum of integrated intensities in fractions 1-25 (see Materials and Methods for details). In the 3-D graph, the y-axis (arbitrary units) is omitted to increase clarity of the graphical display.
Figure 6.
Figure 6.
Sedimentation of bottom fractions 19-22 in second 10-20-30% iodixanol top-bottom gradient. MDCK cells were grown as confluent monolayers on Transwell filters for 3 d after cell-cell adhesion. After separation in a regular 10-20-30% floating iodixanol gradient, fractions 19-22 were combined with half of fractions 4-9. Membranes were spun from the top of the gradient in a 10-20-30% iodixanol gradient as described Materials and Methods. Signal intensity for each protein band was determined as integrated intensity (counts/mm2) and expressed as percentage of the sum of integrated intensities in fractions 1-25 (see Materials and Methods for details). In the 3-D graph, the y-axis (arbitrary units) is omitted to increase clarity of the graphical display.
Figure 4.
Figure 4.
Adherens junction proteins of the AJC in polarized epithelia (3 d after cell-cell adhesion). MDCK cells were grown as confluent monolayers on Transwell filters for 3 d after cell-cell adhesion. (A) 10-20-30% iodixanol gradient. Signal intensity for each protein band was determined as integrated intensity (counts/mm2) and expressed as percentage of the sum of integrated intensities in fractions 1-25 (see Materials and Methods for details). In the 3-D graph, the y-axis (arbitrary units) is omitted to increase clarity of the graphical display. (B) Immunofluorescence. II/III/VI/VII are 3-D reconstructions of confocal z-stacks in a 45°-angled view. I/IV/V/VIII are z-sections of corresponding 3-D reconstructions. Bar, 5 μm.
Figure 5.
Figure 5.
Polarity proteins of the AJC in polarized epithelia (3 d after cell-cell adhesion). MDCK cells were grown as confluent monolayers on Transwell filters for 3 d after cell-cell adhesion. (A) 10-20-30% iodixanol gradient. Signal intensity for each protein band was determined as integrated intensity (counts/mm2) and expressed as percentage of the sum of Integrated Intensities in fractions 1-25 (see Materials and Methods for details). In the 3-D graph, the y-axis (arbitrary units) is omitted to increase clarity of the graphical display. (B) Immunofluorescence. II/III/VI are 3-D reconstructions of confocal z-stacks in a 45°-angled view. I/IV/V are z-sections of corresponding 3-D reconstructions. Bar, 5 μm.
Figure 11.
Figure 11.
Polarity proteins during formation of AJC in 10-20-30% iodixanol gradients. MDCK cells were grown as confluent monolayers on Transwell filters for time points indicated after cell-cell adhesion. After separation of fraction samples by SDS-PAGE followed by immunoblotting, signal intensity for each protein band was determined as integrated intensity (counts/mm2) and expressed as percentage of the sum of integrated intensities in fractions 1-25 (see Materials and Methods for details). In the 3-D graph, the y-axis (arbitrary units) is omitted to increase clarity of the graphical display.
Figure 7.
Figure 7.
Transmembrane proteins (A and B) and adherens junction proteins (C and D) during formation of the AJC (6 h after cell-cell adhesion). MDCK cells were grown as confluent monolayers on Transwell filters for 6 h after cell-cell adhesion. (A and C) 10-20-30% iodixanol gradient. After separation of fraction samples by SDS-PAGE followed by immunoblotting, signal intensity for each protein band was determined as integrated intensity (counts/mm2) and expressed as percentage of the sum of integrated intensities in fractions 1-25 (see Materials and Methods for details). In the 3-D graph, the y-axis (arbitrary units) is omitted to increase clarity of the graphical display. (B and D) Immunofluorescence. II/III/VI/VII are 3-D reconstructions of confocal z-stacks in a 45°-angled view. I/IV/V/VIII are z-sections of corresponding 3-D reconstructions. Bar, 5 μm.
Figure 8.
Figure 8.
Tight junctional (A and B) and polarity proteins (C and D) during formation of the AJC (6 h after cell-cell adhesion). MDCK cells were grown as confluent monolayers on Transwell filters for 6 h after cell-cell adhesion. (A and C) 10-20-30% iodixanol gradient. After separation of fraction samples by SDS-PAGE followed by immunoblotting, signal intensity for each protein band was determined as integrated intensity (counts/mm2) and expressed as percentage of the sum of integrated intensities in fractions 1-25 (see Materials and Methods for details). In the 3-D graph, the y-axis (arbitrary units) is omitted to increase clarity of the graphical display. (B and D) Immunofluorescence. II/III/VI are 3-D reconstructions of confocal z-stacks in a 45°-angled view. I/IV/V are z-sections of corresponding 3-D reconstructions. Bar, 5 μm.
Figure 12.
Figure 12.
Protein distributions in distinct membrane substructures of the apical junctional complex in polarized epithelia.

References

    1. Aberle, H., Butz, S., Stappert, J., Weissig, H., Kemler, R., and Hoschuetzky, H. (1994). Assembly of the cadherin-catenin complex in vitro with recombinant proteins. J. Cell Sci. 107, 3655-3663. - PubMed
    1. Amieva, M. R., Vogelmann, R., Covacci, A., Tompkins, L. S., Nelson, W. J., and Falkow, S. (2003). Disruption of the epithelial apical-junctional complex by Helicobacter pylori CagA. Science 300, 1430-1434. - PMC - PubMed
    1. Anderson, J. M., Van Itallie, C. M., and Fanning, A. S. (2004). Setting up a barrier at the apical junction complex. Curr. Opin. Cell Biol. 16, 140-145. - PubMed
    1. Bazzoni, G., Martinez-Estrada, O. M., Orsenigo, F., Cordenonsi, M., Citi, S., and Dejana, E. (2000). Interaction of junctional adhesion molecule with the tight junction components ZO-1, cingulin, and occludin. J. Biol. Chem. 275, 20520-20526. - PubMed
    1. Brajenovic, M., Joberty, G., Kuster, B., Bouwmeester, T., and Drewes, G. (2004). Comprehensive proteomic analysis of human Par protein complexes reveals an interconnected protein network. J. Biol. Chem. 279, 12804-12811. - PubMed

Publication types

MeSH terms