Changes in genomewide occupancy of core transcriptional regulators during heat stress
- PMID: 15548603
- PMCID: PMC534727
- DOI: 10.1073/pnas.0404988101
Changes in genomewide occupancy of core transcriptional regulators during heat stress
Abstract
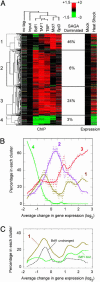
Organisms respond to heat stress by reprogramming gene expression. In Saccharomyces cerevisiae, heat-induced genes tend to be regulated by factors that belong to the Spt-Ada-Gcn5 acetyltransferase (SAGA) transcription regulatory pathway, whereas heat-repressed genes tend to be regulated by a parallel pathway involving transcription factor IID (TFIID). Here, we examine whether heat stress affects the occupancy of representative factors of each pathway at promoter regions throughout the yeast genome. Representatives of the SAGA pathway include the TATA binding protein, Spt3, and Mot1. Representatives of the TFIID pathway include the TATA binding protein, TAF1, and Bdf1. We find that heat stress causes disassembly of the TFIID pathway at genes that are inhibited by stress. In contrast, heat induces assembly of the SAGA pathway at stress-induced genes, although many also assemble along the TFIID pathway. Other genes were found to assemble almost exclusively along the TFIID pathway. Strikingly, these genes are lowly transcribed and are generally not induced. Thus, heat stress leads to factor assembly along each pathway but with distinct transcriptional outcomes. Further investigation of these pathways reveals that Bdf1 and Mot1 negatively regulate the SAGA pathway in different ways. The findings suggest that Bdf1 blocks assembly, whereas Mot1 promotes disassembly of the transcription machinery.
Figures


Similar articles
-
Sequential recruitment of SAGA and TFIID in a genomic response to DNA damage in Saccharomyces cerevisiae.Mol Cell Biol. 2011 Jan;31(1):190-202. doi: 10.1128/MCB.00317-10. Epub 2010 Oct 18. Mol Cell Biol. 2011. PMID: 20956559 Free PMC article.
-
Differential requirement of SAGA subunits for Mot1p and Taf1p recruitment in gene activation.Mol Cell Biol. 2005 Jun;25(12):4863-72. doi: 10.1128/MCB.25.12.4863-4872.2005. Mol Cell Biol. 2005. PMID: 15923605 Free PMC article.
-
The function of Spt3, a subunit of the SAGA complex, in PGK1 transcription is restored only partially when reintroduced by plasmid into taf1 spt3 double mutant yeast strains.Genes Genet Syst. 2020 Aug 27;95(3):151-163. doi: 10.1266/ggs.20-00004. Epub 2020 Jul 4. Genes Genet Syst. 2020. PMID: 32624556
-
Distinct regulatory mechanisms of eukaryotic transcriptional activation by SAGA and TFIID.Biochim Biophys Acta. 2011 Feb;1809(2):97-108. doi: 10.1016/j.bbagrm.2010.08.009. Epub 2010 Aug 26. Biochim Biophys Acta. 2011. PMID: 20800707 Free PMC article. Review.
-
The role of chromatin structure in regulating stress-induced transcription in Saccharomyces cerevisiae.Biochem Cell Biol. 2006 Aug;84(4):477-89. doi: 10.1139/o06-079. Biochem Cell Biol. 2006. PMID: 16936821 Review.
Cited by
-
Basal core promoters control the equilibrium between negative cofactor 2 and preinitiation complexes in human cells.Genome Biol. 2010;11(3):R33. doi: 10.1186/gb-2010-11-3-r33. Epub 2010 Mar 15. Genome Biol. 2010. PMID: 20230619 Free PMC article.
-
Full and partial genome-wide assembly and disassembly of the yeast transcription machinery in response to heat shock.Genes Dev. 2006 Aug 15;20(16):2250-65. doi: 10.1101/gad.1437506. Genes Dev. 2006. PMID: 16912275 Free PMC article.
-
The TAF9 C-terminal conserved region domain is required for SAGA and TFIID promoter occupancy to promote transcriptional activation.Mol Cell Biol. 2014 May;34(9):1547-63. doi: 10.1128/MCB.01060-13. Epub 2014 Feb 18. Mol Cell Biol. 2014. PMID: 24550006 Free PMC article.
-
Genome-wide transcriptional dependence on conserved regions of Mot1.Mol Cell Biol. 2011 Jun;31(11):2253-61. doi: 10.1128/MCB.01464-10. Epub 2011 Mar 28. Mol Cell Biol. 2011. PMID: 21444714 Free PMC article.
-
Genome-wide dynamics of Htz1, a histone H2A variant that poises repressed/basal promoters for activation through histone loss.Cell. 2005 Oct 21;123(2):219-31. doi: 10.1016/j.cell.2005.08.036. Cell. 2005. PMID: 16239141 Free PMC article.
References
-
- Brownell, J. E., Zhou, J., Ranalli, T., Kobayashi, R., Edmondson, D. G., Roth, S. Y. & Allis, C. D. (1996) Cell 84, 843–851. - PubMed
-
- Mizzen, C. A., Yang, X. J., Kokubo, T., Brownell, J. E., Bannister, A. J., Owen-Hughes, T., Workman, J., Wang, L., Berger, S. L., Kouzarides, T., et al. (1996) Cell 87, 1261–1270. - PubMed
-
- Grant, P. A., Duggan, L., Cote, J., Roberts, S. M., Brownell, J. E., Candau, R., Ohba, R., Owen-Hughes, T., Allis, C. D., Winston, F., et al. (1997) Genes Dev. 11, 1640–1650. - PubMed
-
- Huisinga, K. L. & Pugh, B. F. (2004) Mol. Cell 13, 573–585. - PubMed
Publication types
MeSH terms
Substances
Grants and funding
LinkOut - more resources
Full Text Sources
Molecular Biology Databases
Research Materials

